ANZ Group Holdings Limited technical forecast [Video]
![ANZ Group Holdings Limited technical forecast [Video]](https://editorial.fxstreet.com/images/i/bullish-line_XtraLarge.png)
ASX: ANZ Elliott Wave technical analysis
Today’s Elliott Wave analysis provides an update on the Australian Stock Exchange (ASX) with ANZ GROUP HOLDINGS LIMITED – ANZ.
Our current analysis suggests that ASX: ANZ is likely to continue its downward movement in the short term. However, once the corrective wave concludes, there is a strong possibility of a return to the main trend with Wave 5.
This raises important questions: Is this the right time to buy ANZ stocks? How should one approach buying? Where is the optimal entry point?
Today’s analysis aims to clarify these aspects.
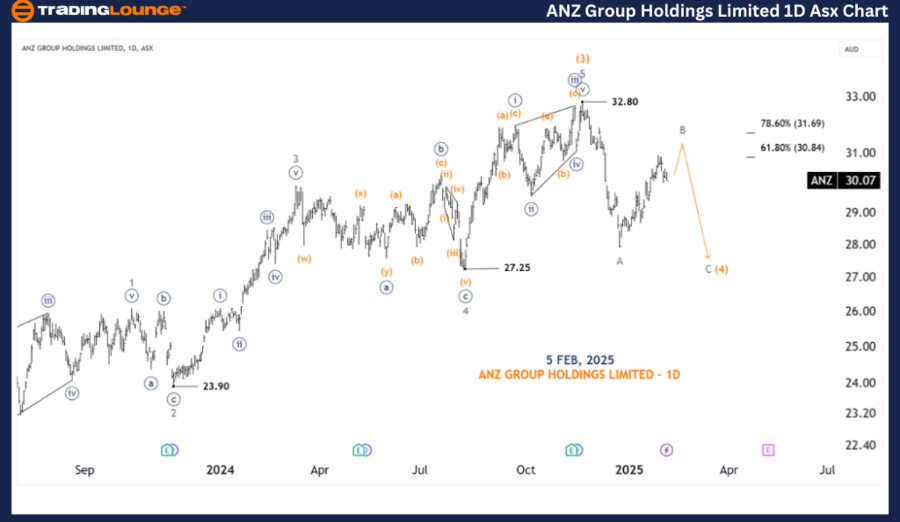
ASX: ANZ Elliott Wave Technical Analysis – Daily chart
-
Function: Major Trend (Intermediate Degree, Orange).
-
Mode: Motive.
-
Structure: Impulse.
-
Position: Wave ((b)) – Navy of Wave 4 – Orange.
Details:
-
Wave (3) – Orange concluded as a five-wave impulse at the 32.80 high.
-
The price is currently moving lower with Wave (4) – Orange.
-
It is unlikely that Wave (4) – Orange has been completed yet.
-
The development of the ABC-Grey corrective pattern suggests that Wave B-Grey is nearing completion, with Wave C-Grey expected to push the price lower.
Invalidation point: 32.80
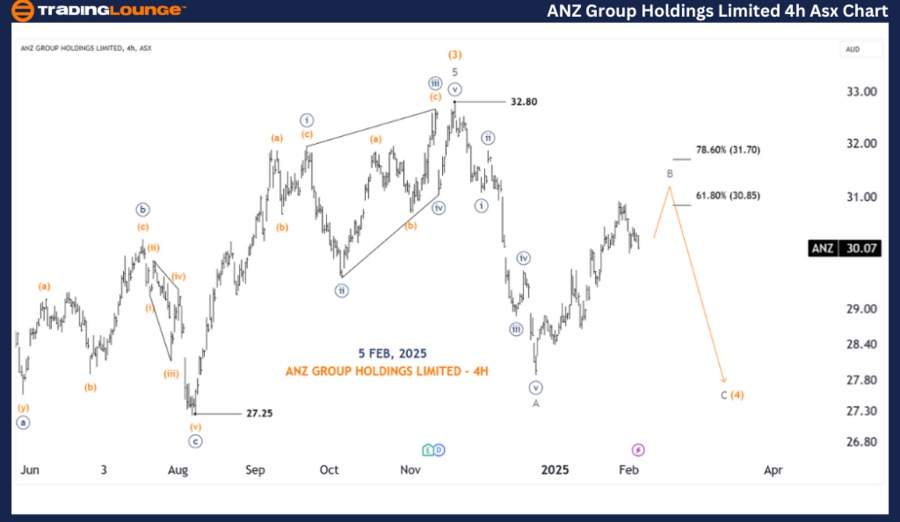
ASX: ANZ four-hour chart analysis
-
Function: Major Trend (Minor Degree, Grey).
-
Mode: Motive.
-
Structure: Impulse.
-
Position: Wave B-Grey of Wave (4) – Orange.
Details:
-
Wave A-Grey of Wave (4) – Orange has been completed.
-
Wave B-Grey is nearing completion, having reached significant price levels.
-
Once Wave B-Grey finalizes, Wave C-Grey is expected to push the price lower.
Invalidation Point: 32.80
Conclusion
Our Elliott Wave analysis for ASX: ANZ GROUP HOLDINGS LIMITED – ANZ aims to provide valuable insights into current market trends and strategic trading opportunities.
By identifying key price levels that confirm or invalidate our wave count, we enhance the confidence in our projections. Combining technical expertise with market trends, we offer an objective and professional outlook for traders.
ANZ Group Holdings Limited technical forecast [Video]
Author

Peter Mathers
TradingLounge
Peter Mathers started actively trading in 1982. He began his career at Hoei and Shoin, a Japanese futures trading company.


