|

AMZN Elliott Wave technical analysis [Video]

AMZN Elliott Wave technical analysis

  • Function: Trend.

  • Mode: Impulsive.

  • Structure: Motive.

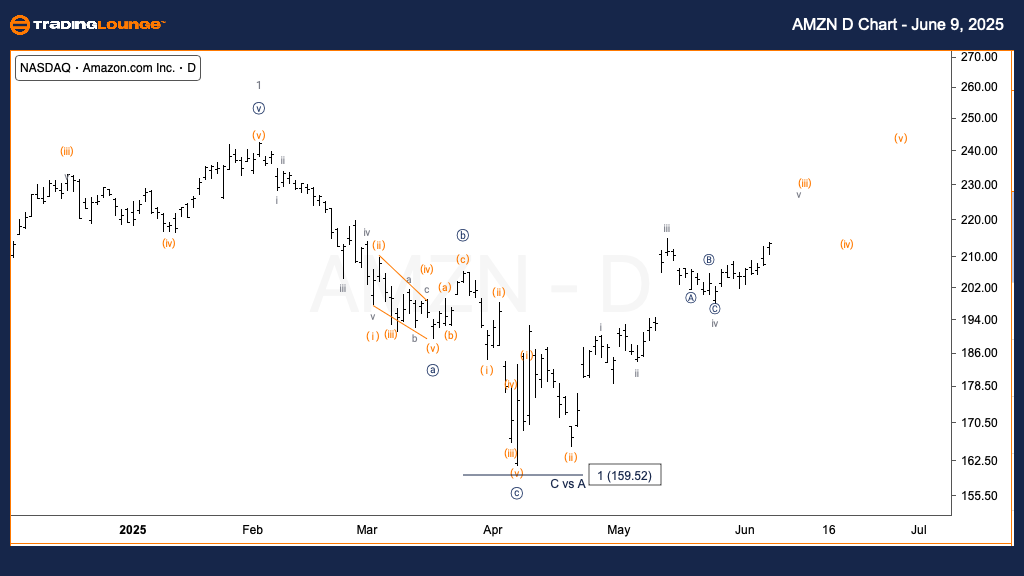
  • Position: Wave v of (iii).

  • Direction: Upward move in wave (iii).

Details:

We expect continued upward movement in Minuette wave (iii). After consolidating for about two weeks near the $200 level (TradingLevel2), AMZN is now targeting the upper boundary of MinorGroup1. This signals the next phase of the upward trend may be underway.

Chart

AMZN Elliott Wave technical analysis

  • Function: Trend.

  • Mode: Impulsive.

  • Structure: Motive.

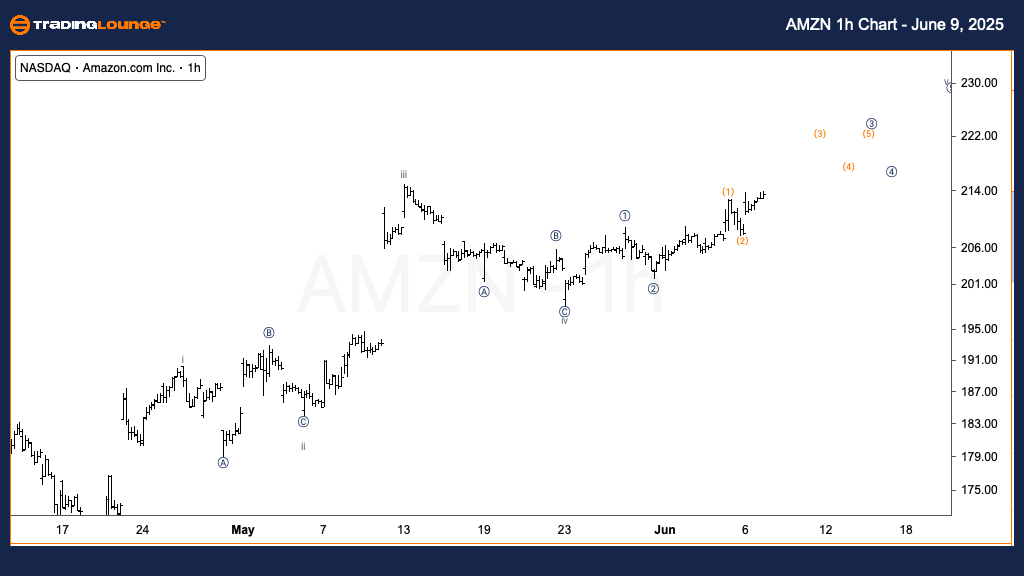
  • Position: Wave 3 of iii.

  • Direction: Upward momentum in microwave 3.

Details:

A sharp move is developing into submicro wave 3 of micro wave 3, reinforcing the current bullish trend. The price is gaining momentum, which supports the wave count and suggests further upside potential.

Chart

Overview

This Elliott Wave analysis reviews Amazon.com Inc. (AMZN) using both daily and 1-hour charts to interpret current price action through the lens of Elliott Wave Theory. The larger trend shows strength through Minuette wave (iii), while short-term action confirms the count with accelerating movement in micro waves.

AMZN Elliott Wave technical analysis [Video]

Author

Peter Mathers

Peter Mathers

TradingLounge

Peter Mathers started actively trading in 1982. He began his career at Hoei and Shoin, a Japanese futures trading company.

More from Peter Mathers
Share:

Editor's Picks

EUR/USD trims gains, hovers around 1.1900 post-US data

EUR/USD trades slightly on the back foot around the 1.1900 region in a context dominated by the resurgence of some buying interest around the US Dollar on turnaround Tuesday. Looking at the US docket, Retail Sales disappointed expectations in December, while the ADP 4-Week Average came in at 6.5K.

GBP/USD comes under pressure near 1.3680

The better tone in the Greenback hurts the risk-linked complex on Tuesday, prompting GBP/USD to set aside two consecutive days of gains and trade slightly on the defensive below the 1.3700 mark. Investors, in the meantime, keep their attention on key UK data due later in the week.

Gold loses some traction, still above $5,000

Gold faces some selling pressure on Tuesday, surrendering part of its recent two-day advance although managing to keep the trade above the $5,000 mark per troy ounce. The daily pullback in the precious metal comes in response to the modest rebound in the US Dollar, while declining US Treasury yields across the curve seem to limit the downside.

Bitcoin Cash trades lower, risks dead-cat bounce amid bearish signals

Bitcoin Cash trades in the red below $522 at the time of writing on Tuesday, after multiple rejections at key resistance. BCH’s derivatives and on-chain indicators point to growing bearish sentiment and raise the risk of a dead-cat bounce toward lower support levels.

Dollar drops and stocks rally: The week of reckoning for US economic data

Following a sizeable move lower in US technology Stocks last week, we have witnessed a meaningful recovery unfold. The USD Index is in a concerning position; the monthly price continues to hold the south channel support.

Bitcoin Cash trades lower, risks dead-cat bounce amid bearish signals

Bitcoin Cash (BCH) trades in the red below $522 at the time of writing on Tuesday, after multiple rejections at key resistance. BCH’s derivatives and on-chain indicators point to growing bearish sentiment and raise the risk of a dead-cat bounce toward lower support levels.