AMD Stock Forecast: Advanced Micro Devices Eases-off six-day highs, defends $150
- AMD stock fell just under 1% on Monday.
- Advanced Micro Devices current pattern means a heavy run-up may be in the works.
- AMD surged over 10% on November 8 after Meta Platforms said it would use EPYC processors in its data centers.

Update November 18: Advanced Micro Devices Inc (AMD) enjoyed good two-way businesses on Wednesday, initially advancing to six-day highs of $154.66 before retreating sharply to hit a daily low of $149.69. The AMD stock, however, recovered some ground to settle at $151.34, shedding 0.73% on the day. The recent rise in the chip designer company comes on the back of the news that AMD is set to become Samsung Foundry's first 3-nanometer (3nm) customer.
On Tuesday after an hour into the New York trading session, Advanced Micro Devices (AMD) broke out of the bull flag pattern it has been trading in since last week. At 11:00am EST, AMD stock traded up to $151.07, up 3.1%. Trading within a bull flag pattern since November 8, AMD shares are now expected to realize another run, with FXStreet's current prediction at $232.50.
Advanced Micro Devices (AMD) Stock News: a supercomputer king
Advanced Micro Devices announced that at this year's Supercomputing Conference, which is taking place currently through November 19 in St. Louis, it has more than tripled the percentage of the world's top 500 supercomputers that are powered by AMD tech. The chip maker now powers 73 of the top 500 supercomputers compared to 21 – the figure from 2020. The company also powers four of the top ten supercomputers in the world.
“The demands of supercomputing users have increased exponentially as the world seeks to accelerate research, reducing the time to discovery of valuable information,” said Forrest Norrod, senior vice president and general manager of the Data Center & Embedded Solutions Business Group at AMD. “With AMD EPYC CPUs and Instinct accelerators, we continue to evolve our product offering to push the boundaries of data center technologies, enabling faster research, better outcomes and more impact on the world.”
Last week IBM's cloud division announced that it has chosen AMD's 3rd Gen AMD EPYC processors for its IBM Cloud Bare Metal Servers. The new server offering from IBM features 128 cores, up to 4TB of memory and 10 NVMe drives per server. AMD says the processors are particularly good for "compute-intensive workloads, virtualized environments, large-scale databases" and hosting massive multiplayer online games.
AMD key statistics
| Market Cap | $181.3 billion |
| Price/Earnings | 46.2 |
| Price/Sales | 12.4 |
| Price/Book | 25.4 |
| Enterprise Value | $178.3 billion |
| Operating Margin | 20.5% |
| Profit Margin |
26.7% |
| 52-week high | $155.57 |
| 52-week low | $72.50 |
| Short Interest | 5.8% |
| Average Wall Street Rating and Price Target | Hold $140.51 |
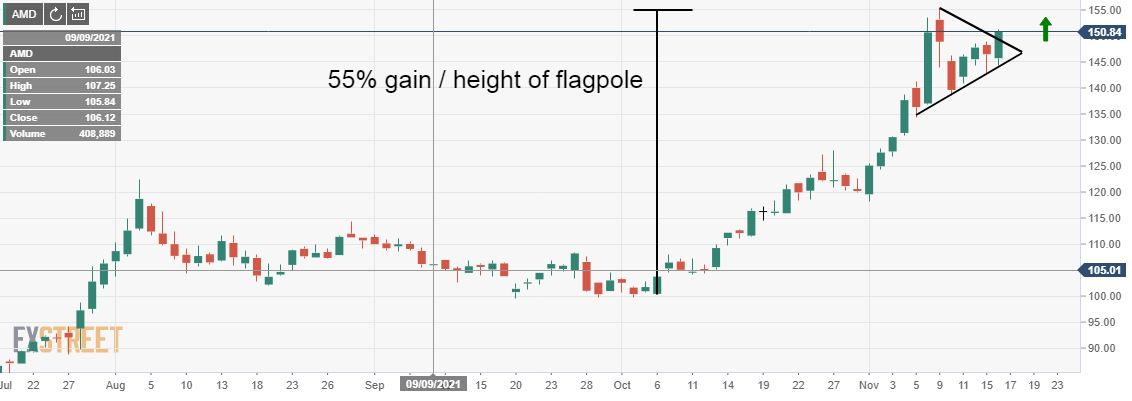
Advanced Micro Devices (AMD) Stock Forecast: expect a 55% run
AMD stock broke out on Monday, November 8, bounding up 10.1% on news that the former Facebook, now known as Meta Platforms (Wah-wuh!), made the decision to power its new generation of data centers with AMD's EPYC processors and servers.
Quickly, the stock corrected and began slowly edging higher in what appeared to be the consolidation pattern known as a bull flag.
As we wrote last Friday: "Some might even venture to call this a bull-flag formation. This formation takes place when you have a large-scale run-up in a stock in a rather short period of time, so that when you zoom out on the chart, the surge seems almost vertical. This part is called the flagpole. When it hits an extreme high, such as Tuesday's high of $155.57, the stock then consolidates in the shape of a flag or pennant.
"This pennant has a downward slanting top line and an ascending bottom line that meet somewhere in the near future. Typically, this pattern stems from bulls buying up the shares of other traders who are taking profits. Once all the liquidity is taken from the market, the stock rises above the pennant's top line. When it does, the theory says the new spike will be equal to the percentage gain from the prior flagpole.
"If this were to happen for AMD, the resulting spike off the pennant (placed somewhere around $150) would present the opportunity for AMD stock price to jump to $232.50, which is another 55% journey from the breakout point."
So there you have it folks. A number of things could change in the market, but the current consolidation pattern followed by Tuesday's breakout spells another strong run for AMD stock. Many barriers remain in the way, but now is the time to go long AMD stock. As always, use stops.
AMD daily chart
Previous updates
Update: On Wednesday, the stock outperformed in its field but made losses on the day, ending down 0.73%, falling from a high of $154.66 to a low of $149.69. However, it is 81.12% higher over the last 12 months. AMD earned $3.23 per share over this period also, giving it a price-to-earnings ratio of 46.89.
The technical outlook for the stock, however, is mixed. The price rallied the prior day and left a bullish engulfing candle but there was no follow-through on Wednesday. Therefore, this invalidates the immediate bullish outlook, at least from the engulfing candle theory's perspective. While there are possibilities of an onward continuation for the days ahead, a restest of the 15. Nov candle's highs should not be ruled out. These come in at $148.98 and will meet a 4-hour 10 SMMA as potential support. However, a W-formation on the 4-hour chart and its neckline at $146.90 is compelling below there.
Premium
You have reached your limit of 3 free articles for this month.
Start your subscription and get access to all our original articles.
Author

Clay Webster
FXStreet
Clay Webster grew up in the US outside Buffalo, New York and Lancaster, Pennsylvania. He began investing after college following the 2008 financial crisis.


