AMCOR PLC – AMC Elliott Wave technical forecast [Video]
![AMCOR PLC – AMC Elliott Wave technical forecast [Video]](https://editorial.fxsstatic.com/images/i/charts-01_XtraLarge.jpg)
AMCOR PLC – AMC Elliott Wave technical analysis
Our Elliott Wave analysis provides an updated view of AMCOR PLC (ASX:AMC) on the Australian Stock Exchange (ASX).
There appears to be a strong potential for AMC to initiate a third wave. This report outlines the key target zones and invalidation levels that support this analysis.
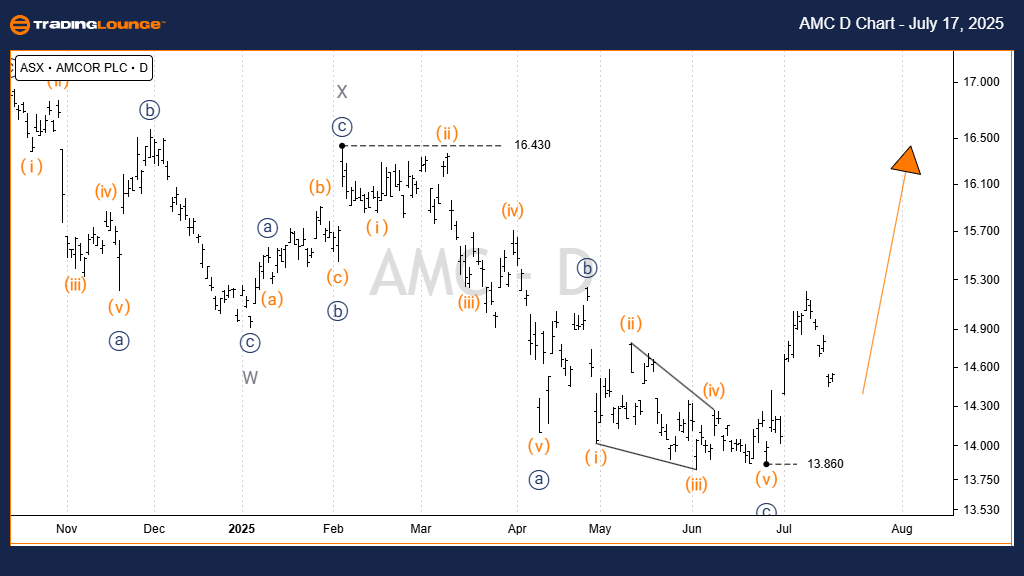
One-day chart (semilog scale) analysis
-
Function: Major trend (Intermediate degree, Orange).
-
Mode: Motive.
-
Structure: Impulse.
-
Position: Wave 3) – orange.
Details:
Wave 3) – orange seems to be developing upward. Since the low at 13.35, wave 3)) – navy has started forming and is an extended wave. It subdivides into wave 1), 2) – orange, which may now be complete. From the 13.82 low, wave 3) – orange is expected to rise, with a target between 17.56 and 20.37.
The price must remain above 13.82 to keep the current upward trend of wave 5)) – navy intact.
- Invalidation point: 13.86.
AMC Elliott Wave technical analysis – Four-hour chart
-
Function: Major trend (Intermediate degree, orange).
-
Mode: Motive.
-
Structure: Impulse.
-
Position: Wave 3) – orange.
Details:
The structure remains intact. The chart shows upward movement toward the recent high of 16.43, with potential to go higher.
Maintaining the price above 13.86 is crucial for keeping this outlook valid.
- Invalidation point: 13.86.

Conclusion
Our analysis on AMCOR PLC – AMC focuses on identifying both long-term trends and short-term opportunities.
We present precise price zones that validate or invalidate wave counts, adding strength to our forecast.
By combining technical detail with strategic forecasting, we aim to give traders a clear and professional market outlook.
AMCOR PLC – AMC Elliott Wave technical forecast [Video]
Author

Peter Iosif, ACA, MBA
IronFX
Mr. Iosif joined IronFX in 2017 as part of the sales force. His high level of competence and expertise enabled him to climb up the company ladder quickly and move to the IronFX Strategy team as a Research Analyst. Mr.


