AMC Entertainment Holdings Stock Price and Forecast: Why is AMC up? Rises 6% on Q2 earnings beat
- AMC released earnings after the close on Monday.
- AMC stock price pops as EPS and revenue beat estimates.
- AMC is still the meme space king and has over $2 billion in liquidity.

Update: AMC reported earnings after the close on Monday. The results were ahead of expectations for the meme stock king. Earnings Per Share (EPS) came in at $-0.71 ahead of the $-0.92 estimate from Wall Street. Revenue came in at $444.7 million smashing the estimate of $375 million. AMC shares are trading at $35.89 in the post-market on Monday for a gain of 6%. The company said it has over $2billion in liquidity. The conference call is scheduled for 1700 NY 2200 UK time. Details here.
AMC releases earnings after the close on Monday, which will be keenly watched by retail traders who are struggling a bit of late as the stock slides. The results are not likely to offer much comfort for investors as AMC remains in a tough financial position despite economies reopening. The conference call is where things could get interesting with questions likely over further capital raising and debt refinancing possibilities. Also high on the agenda is likely to be the renewed advance of the coronavirus Delta variant and lockdown in territories such as Europe, Asia and Australia and how this will impact earnings projections. A tricky path for sure.
Earnings will be released after the market closes on Monday. Earnings per share is expected to come in at $-0.91, while revenue is expected to jump to $382 million from a mere $19 million a year ago. The conference call link is here.
AMC statistics
| Market Cap | $17 billion |
| Price/Earnings | |
| Price/Sales | 3 |
| Price/Book | |
| Enterprise Value | $14 billion |
| Gross Margin | -1.86 |
| Net Margin |
-6.6 |
| Average Wall Street Rating and Price Target | Sell $5.25 |
AMC stock forecast
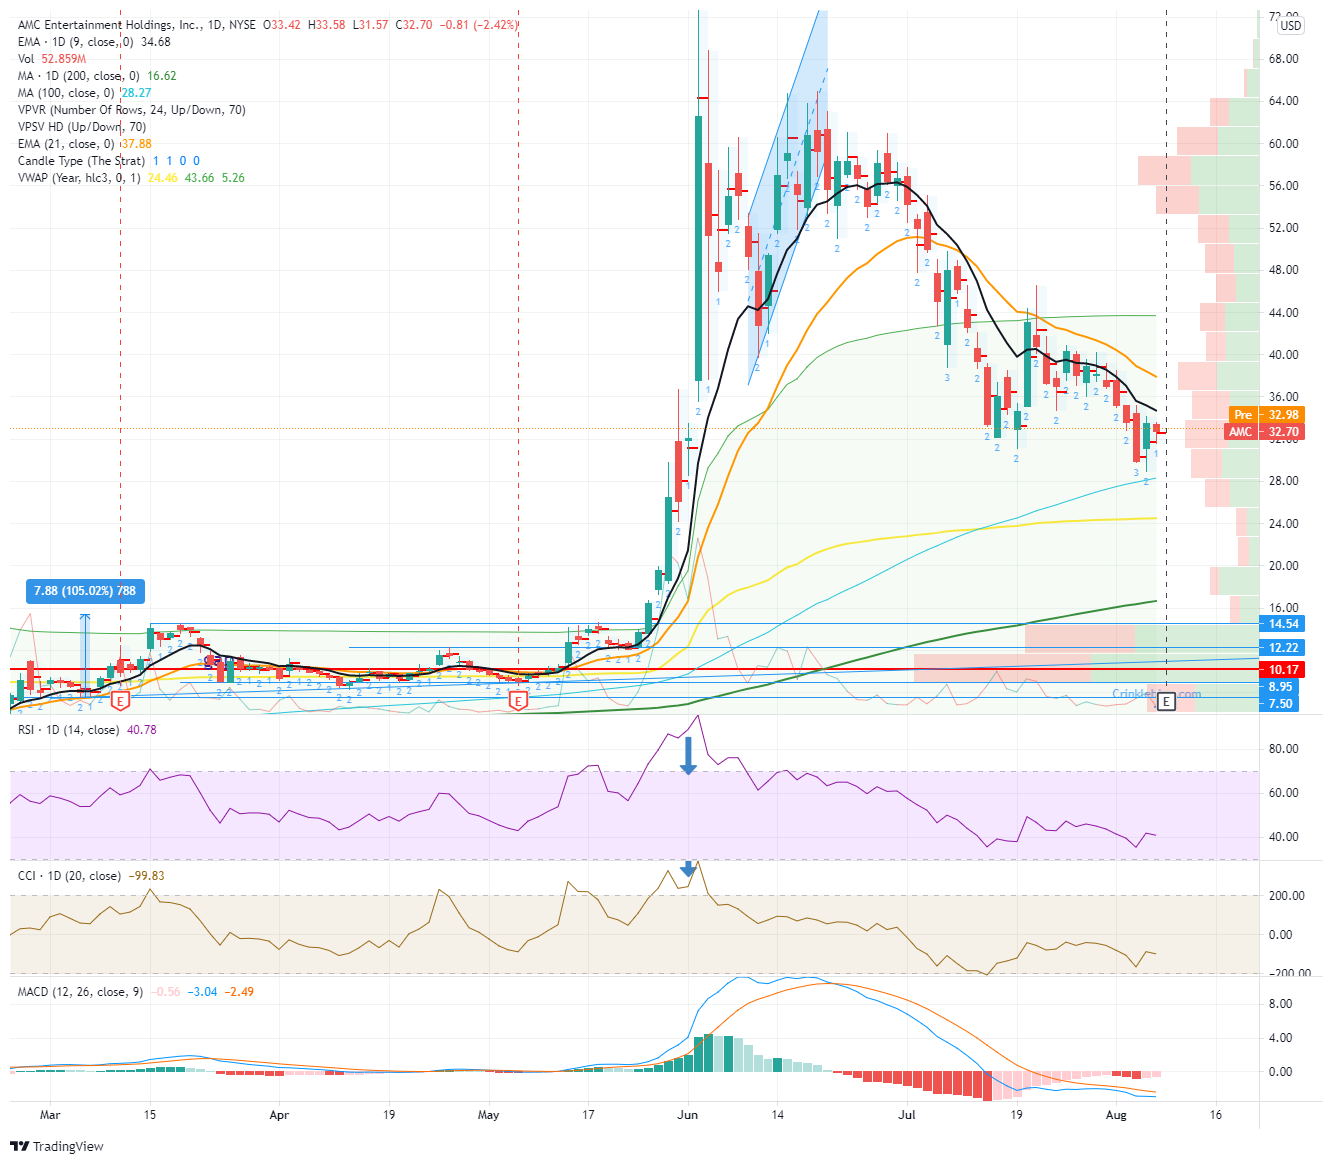
AMC stock has been trending steadily lower since the early summer surge and squeeze up to $72.62. The shares turned bearish clearly from the chart when the consolidation phase ended at the start of July with AMC losing the 9 and then 21-day moving averages. The Relative Strength Index (RSI) and Commodity Channel Index (CCI) had shown as massively overbought and both these indicators have trended lower in line with price, confirming the move.
Unfortunately, given the lack of volume at current levels the first decent support does not come until the $12-14 zone, and below that $10 is the point of control (price with the highest volume). Some support may be found from the yearly VWAP (Volume Weighted Average Price) at $24.46 and the 100-day moving average at $28.27. ABut as ever, use a stop, especially with something as volatile as this one.
To turn bullish, AMC will first need to take out the 9-day moving average at $34.68, but the trend is not bullish until the high from July 21 at $46.55 is broken.
Like this article? Help us with some feedback by answering this survey:
Premium
You have reached your limit of 3 free articles for this month.
Start your subscription and get access to all our original articles.
Author

Ivan Brian
FXStreet
Ivan Brian started his career with AIB Bank in corporate finance and then worked for seven years at Baxter. He started as a macro analyst before becoming Head of Research and then CFO.


