AMC Entertainment Holdings Stock Forecast: AMC holds steady as memes suffer, key chart levels


  • AMC shares continue to defy gravity as the meme space suffers. 
  • Fed passes on Wednesday without doing too much damage to equities.
  • AMC options for Friday expiry look interesting again.

AMC shares continue to defy the odds, gravity and any other form of rational stock analysis as they continue to remain in orbit around the moon. AMC did drop over 6% on Wednesday, but given where the stock has come from, that is merely an intraday move for this type of volatility. Speaking of volatility, it remains hugely elevated. The chart below shows the implied volatility for AMC calls since the start of the GameStop (GME) rally in January. Currently, volatility sits at about 250%. By contrast, volatility for Apple is about 20%. The interesting point to note is despite the huge spike in the AMC stock price in this second wave, volatility has not been as high as back in the original move in January.

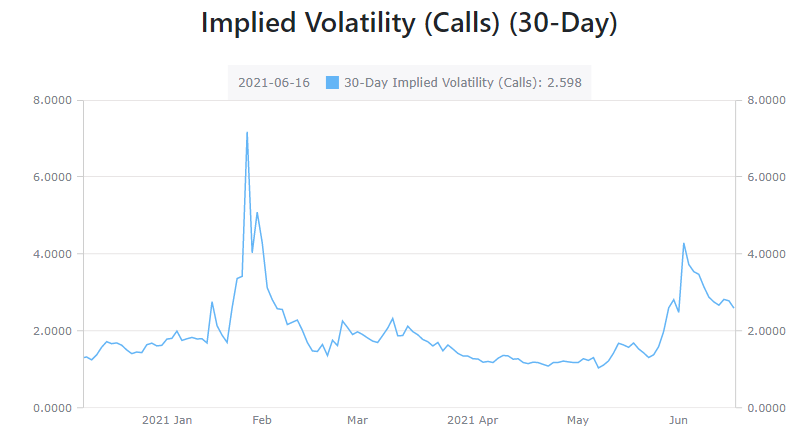
Source: Alphaquery.com

AMC stock forecast

Fridays have been a recent battleground for options expiries in AMC, and this Friday coming proves no different. The surge in the AMC share price has seen a corresponding surge in open interest in call options expiring this Friday. Data from Reuters/Refinitiv below shows the strikes around the money and associated open interest.

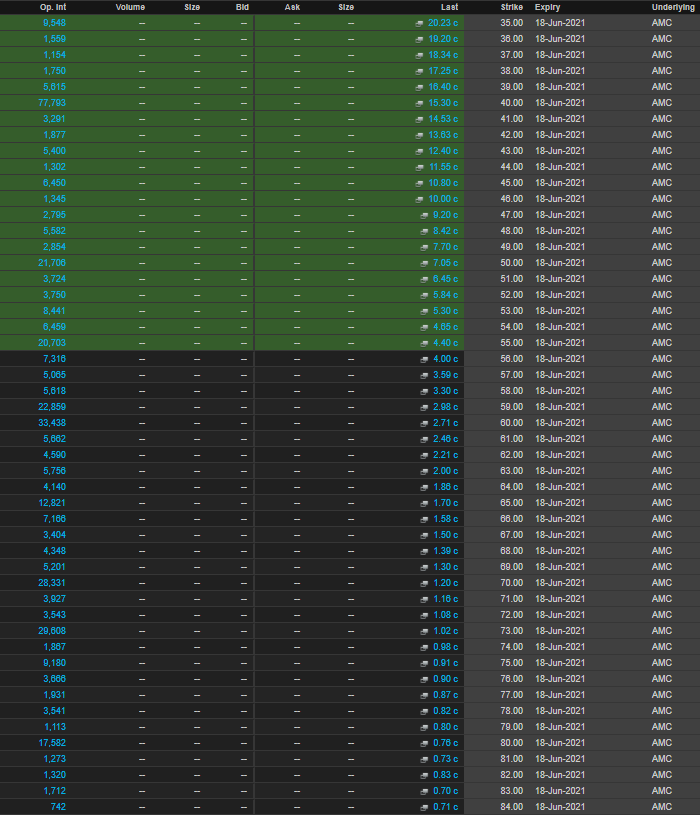
Each option contract is for 100 AMC shares, so approximately 420,000 option contracts between $35 and $84 strikes on this page alone mean 42 million shares will expire if AMC closes above $84 on Friday. It is unlikely that it will close that high, but this is AMC we are talking about! The flip side is the more options that expire worthless or unexercised the more market makers' gamma unwind will see selling pressure on AMC shares.

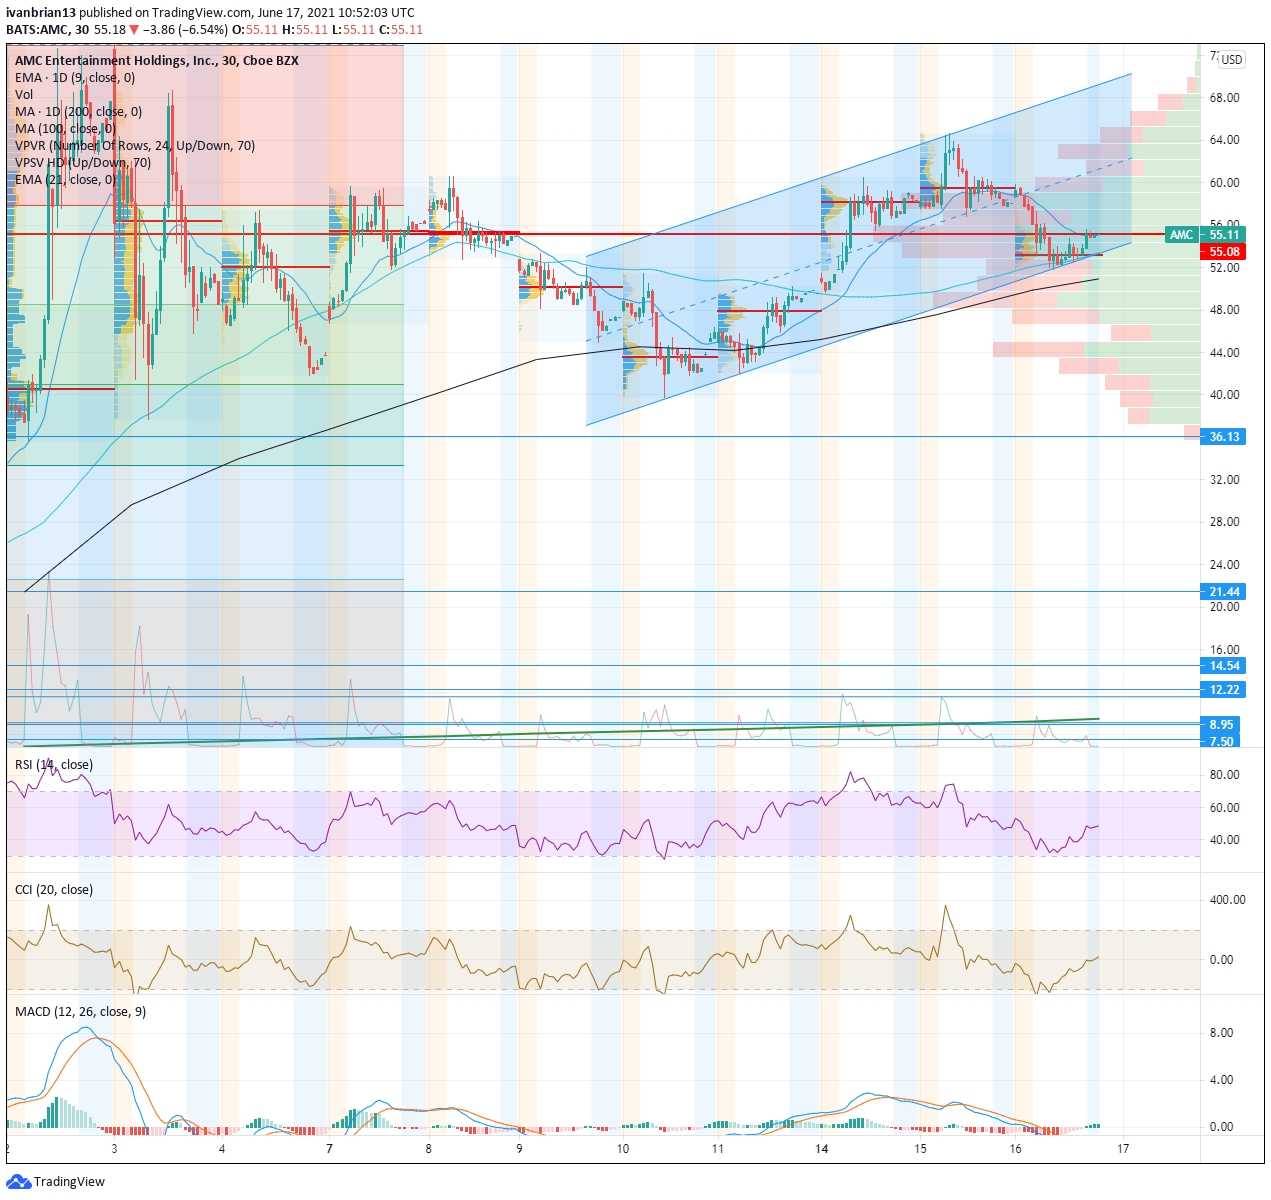
The AMC share price itself has been holding nicely above $50 for most of June so far. The 30-minute chart shows the uptrend in place, and the lower trend line has been acting as support on a short-term, intraday basis. This support is set today at $53.50 but obviously moves as time passes. 

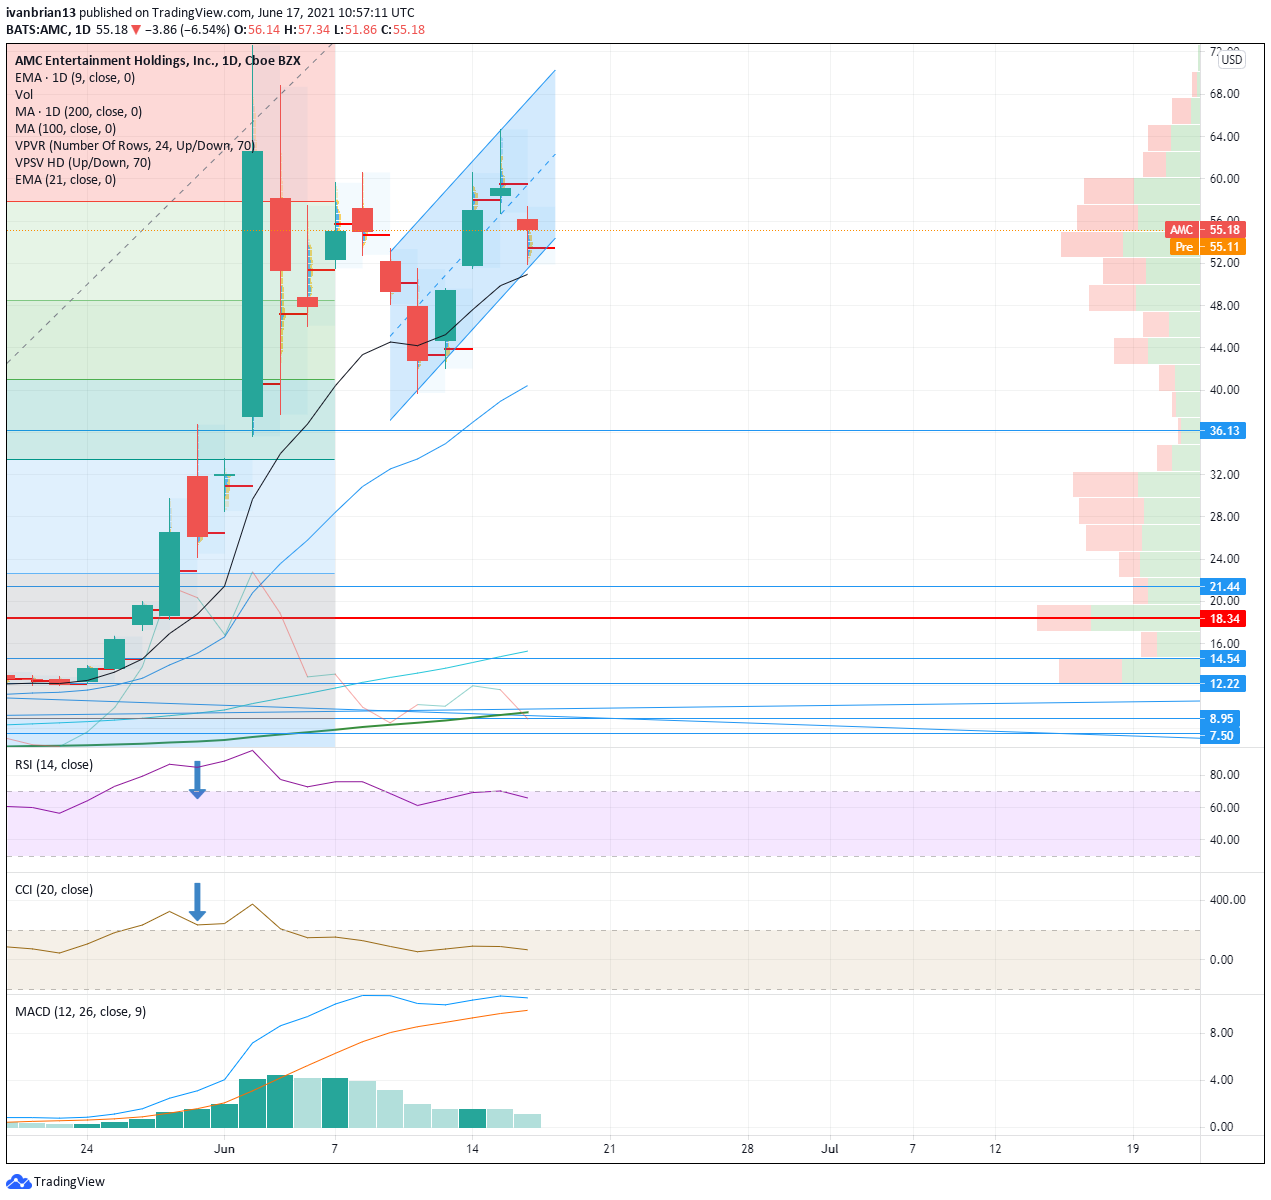
Using the daily chart for a wider viewpoint, but just taking the most recent parabolic move, shows the volume profile drop off alarmingly below $44, meaning a break should accelerate to $32 where volume picks up again. Wednesday's point of control intraday volume was toward the lower end of the daily candle, another bearish factor. The 9-day moving average at $50.94 will give further clues. For now, AMC shares are holding above, so short-term bulls are in charge. A break on the other hand will likely see a test of $44. Tuesday's low of $56.73 is a short-term bullish pivot.

The author is long AMC puts


Share: Feed news

Information on these pages contains forward-looking statements that involve risks and uncertainties. Markets and instruments profiled on this page are for informational purposes only and should not in any way come across as a recommendation to buy or sell in these assets. You should do your own thorough research before making any investment decisions. FXStreet does not in any way guarantee that this information is free from mistakes, errors, or material misstatements. It also does not guarantee that this information is of a timely nature. Investing in Open Markets involves a great deal of risk, including the loss of all or a portion of your investment, as well as emotional distress. All risks, losses and costs associated with investing, including total loss of principal, are your responsibility. The views and opinions expressed in this article are those of the authors and do not necessarily reflect the official policy or position of FXStreet nor its advertisers. The author will not be held responsible for information that is found at the end of links posted on this page.

If not otherwise explicitly mentioned in the body of the article, at the time of writing, the author has no position in any stock mentioned in this article and no business relationship with any company mentioned. The author has not received compensation for writing this article, other than from FXStreet.

FXStreet and the author do not provide personalized recommendations. The author makes no representations as to the accuracy, completeness, or suitability of this information. FXStreet and the author will not be liable for any errors, omissions or any losses, injuries or damages arising from this information and its display or use. Errors and omissions excepted.

The author and FXStreet are not registered investment advisors and nothing in this article is intended to be investment advice.

Recommended content


Recommended content

Editors’ Picks

AUD/USD could extend the recovery to 0.6500 and above

AUD/USD could extend the recovery to 0.6500 and above

The enhanced risk appetite and the weakening of the Greenback enabled AUD/USD to build on the promising start to the week and trade closer to the key barrier at 0.6500 the figure ahead of key inflation figures in Australia.

AUD/USD News

EUR/USD now refocuses on the 200-day SMA

EUR/USD now refocuses on the 200-day SMA

EUR/USD extended its positive momentum and rose above the 1.0700 yardstick, driven by the intense PMI-led retracement in the US Dollar as well as a prevailing risk-friendly environment in the FX universe.

EUR/USD News

Gold struggles around $2,325 despite broad US Dollar’s weakness

Gold struggles around $2,325 despite broad US Dollar’s weakness

Gold reversed its direction and rose to the $2,320 area, erasing a large portion of its daily losses in the process. The benchmark 10-year US Treasury bond yield stays in the red below 4.6% following the weak US PMI data and supports XAU/USD.

Gold News

Bitcoin price makes run for previous cycle highs as Morgan Stanley pushes BTC ETF exposure

Bitcoin price makes run for previous cycle highs as Morgan Stanley pushes BTC ETF exposure

Bitcoin (BTC) price strength continues to grow, three days after the fourth halving. Optimism continues to abound in the market as Bitcoiners envision a reclamation of previous cycle highs.

Read more

US versus the Eurozone: Inflation divergence causes monetary desynchronization

US versus the Eurozone: Inflation divergence causes monetary desynchronization

Historically there is a very close correlation between changes in US Treasury yields and German Bund yields. This is relevant at the current juncture, considering that the recent hawkish twist in the tone of the Federal Reserve might continue to push US long-term interest rates higher and put upward pressure on bond yields in the Eurozone. 

Read more

Forex MAJORS

Cryptocurrencies

Signatures