Alphabet (GOOG Stock) hits -1.618% Fibonacci target and expects pullback
-
Alphabet Stock (GOOG) has had a tremendous bull run for more than 1.5 years. The price has doubled in the last 1 year - since September 2020.
-
Today’s Elliott Wave and price analysis reviews why a bearish correction is needed. But also why an uptrend is expected to continue after the pullback.
-
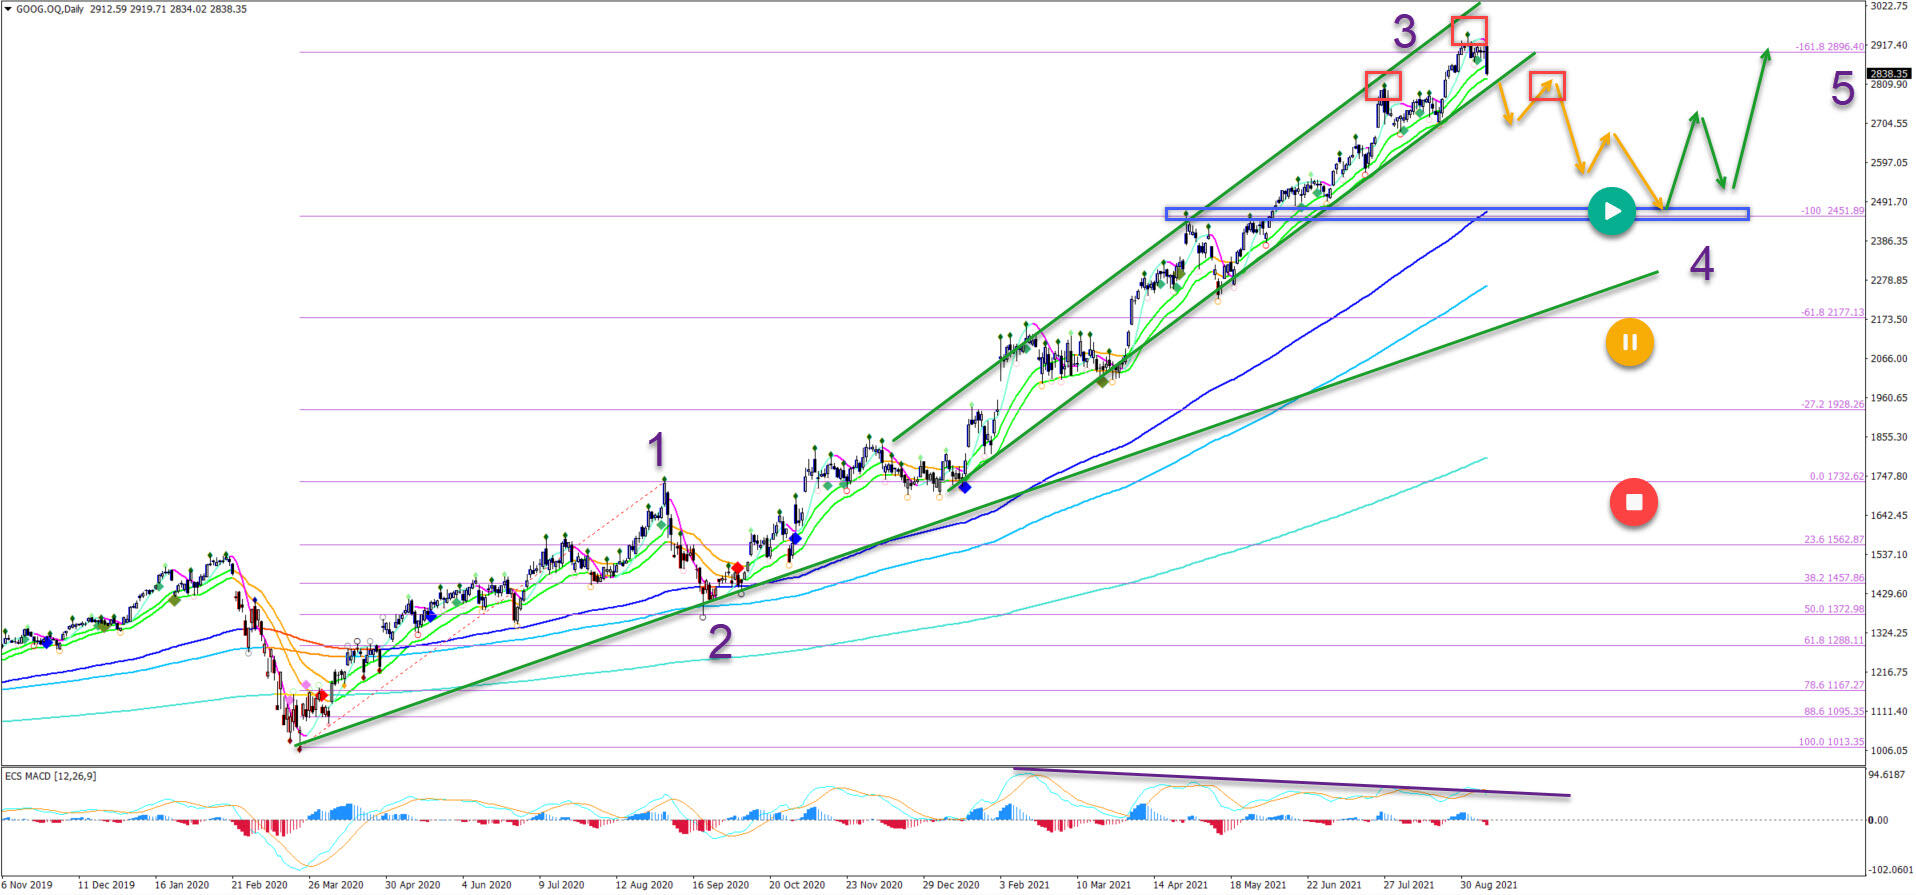
The GOOG stock price has reached the distant -1.618% FIbonacci target of the wave 1-2 (purple). This is a spot where the wave 3 (purple) could be completed.

Price charts and technical analysis
The GOOG stock price has reached the distant -1.618% FIbonacci target of the wave 1-2 (purple). This is a spot where the wave 3 (purple) could be completed:
-
An uptrend is clearly visible when viewing the long-term moving averages.
-
But a divergence pattern has also appeared (purple line).
-
Also the resistance of the strong -1.618% Fibonacci target could start a pullback.
-
The confirmation of a retracement is a break (orange arrows) below the 21 ema zone.
-
A head and shoulders reversal chart pattern could take place (red boxes)
-
The main target of the pullback is the support zone (blue box).
-
An uptrend continuation (green arrows) is expected after price action completes wave 4 (purple) and starts wave 5 (purple).
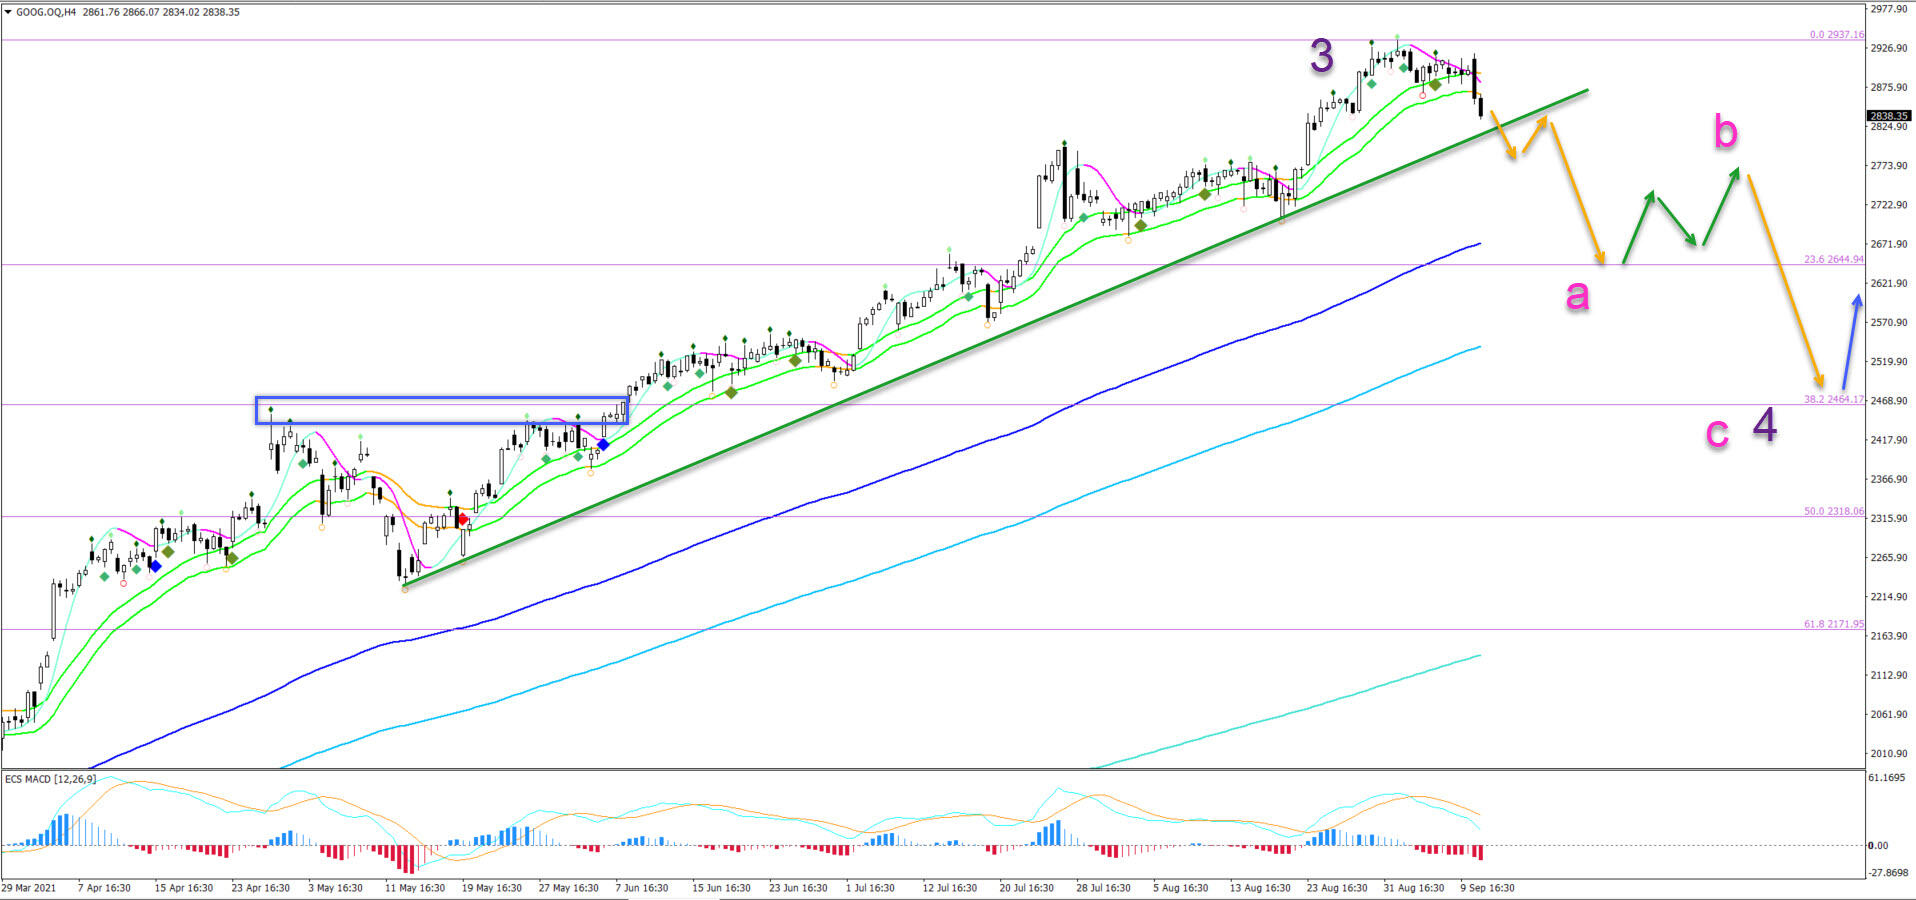
On the 4 hour chart, price action is close to challenging the support trend line (green):
-
A bearish breakout could first aim at the 23.6% Fibonacci level (orange arrows).
-
A bullish bounce could finish wave A (pink) and create a wave B (pink).
-
Another bearish leg (orange arrow) could complete wave C (pink) within wave 4 (purple).
-
A bullish bounce could occur at the 38.2% Fibonacci level (blue arrow).
The analysis has been done with the indicators and template from the SWAT method simple wave analysis and trading. For more daily technical and wave analysis and updates, sign-up to our newsletter
Premium
You have reached your limit of 3 free articles for this month.
Start your subscription and get access to all our original articles.
Author

Chris Svorcik
Elite CurrenSea
Experience Chris Svorcik has co-founded Elite CurrenSea in 2014 together with Nenad Kerkez, aka Tarantula FX. Chris is a technical analyst, wave analyst, trader, writer, educator, webinar speaker, and seminar speaker of the financial markets.


