|

ALB: Pulling back in II before next rally

Albemarle Corporation (ALB) develops, manufactures & markets engineered specialty chemicals worldwide. It operates through three segments, Lithium, Bromine & Catalysts. It is based in Charlotte, NC, which comes under Basic Materials sector & trades under “ALB” ticker at NYSE.

ALB made a short-term low at $48.89 on 3/23/2020. While above there it made ATH at $291.48 within the impulse sequence labelled as I red. Currently, it favors double correction in II & expect to correct lower in between $153.42- $94.84 area before upside resume.

ALB – Elliott Wave latest daily view

ALB

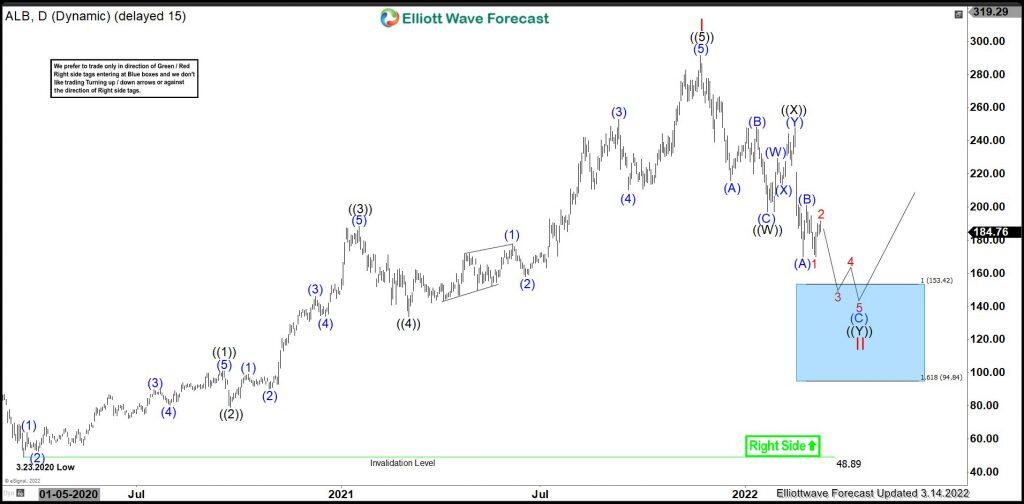
It started impulse cycle from the 3/23/2020 low. It placed ((1)) at $101 high on 9/18/2020 & ((2)) at $85.60 low as 0.382 retracement of ((1)). While above there, it favored ended ((3)) at $188.35 high on 1/20/2021. It placed ((4)) at $133.82 low on 3/05/2021. Finally, it ended ((5)) as extended move at $291.48 high on 11/22/2021 as the part of I red impulse. While below there, it favors double correction lower in II.

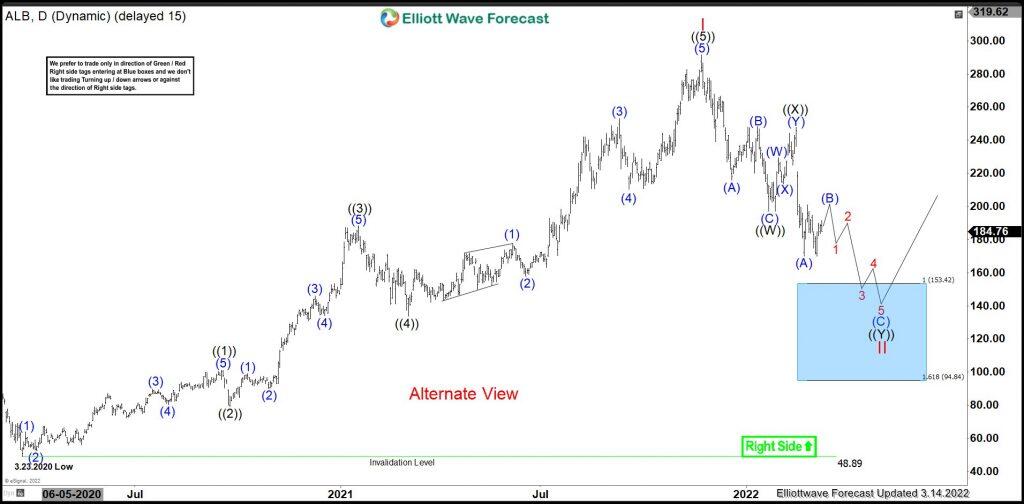
Below $291.48 high, it placed ((W)) at $197.14 low & ((X)) at $247.98 high. While below ((X)), it proposed ended (A) & (B) at $200.88 high & below there favoring (C) lower towards $153.42 – $94.84 area to end ((Y)) to end II correction. Alternatively, it can bounce in (B) as flat correction, which ideally should fail below ((X)) high to extend lower in (C) of ((Y)). We like to buy the blue box area for the next leg higher or at least 3 swing bounce later when reached.

ALB – Alternate Elliott Wave view

ALB

Author

Elliott Wave Forecast Team

Elliott Wave Forecast Team

ElliottWave-Forecast.com

More from Elliott Wave Forecast Team
Share:

Editor's Picks

EUR/USD trims gains, hovers around 1.1900 post-US data

EUR/USD trades slightly on the back foot around the 1.1900 region in a context dominated by the resurgence of some buying interest around the US Dollar on turnaround Tuesday. Looking at the US docket, Retail Sales disappointed expectations in December, while the ADP 4-Week Average came in at 6.5K.

GBP/USD comes under pressure near 1.3680

The better tone in the Greenback hurts the risk-linked complex on Tuesday, prompting GBP/USD to set aside two consecutive days of gains and trade slightly on the defensive below the 1.3700 mark. Investors, in the meantime, keep their attention on key UK data due later in the week.

Gold loses some traction, still above $5,000

Gold faces some selling pressure on Tuesday, surrendering part of its recent two-day advance although managing to keep the trade above the $5,000 mark per troy ounce. The daily pullback in the precious metal comes in response to the modest rebound in the US Dollar, while declining US Treasury yields across the curve seem to limit the downside.

XRP holds $1.40 amid ETF inflows and stable derivatives market

Ripple trades under pressure, with immediate support at $1.40 holding at the time of writing on Tuesday. A recovery attempt from last week’s sell-off to $1.12 stalled at $1.54 on Friday, leading to limited price action between the current support and the resistance.

Dollar drops and stocks rally: The week of reckoning for US economic data

Following a sizeable move lower in US technology Stocks last week, we have witnessed a meaningful recovery unfold. The USD Index is in a concerning position; the monthly price continues to hold the south channel support.

Bitcoin Cash trades lower, risks dead-cat bounce amid bearish signals

Bitcoin Cash (BCH) trades in the red below $522 at the time of writing on Tuesday, after multiple rejections at key resistance. BCH’s derivatives and on-chain indicators point to growing bearish sentiment and raise the risk of a dead-cat bounce toward lower support levels.