Adobe Inc. (ADBE) Elliott Wave technical analysis [Video]
![Adobe Inc. (ADBE) Elliott Wave technical analysis [Video]](https://editorial.fxsstatic.com/images/i/stock-01_XtraLarge.jpg)
Adobe Inc. (ADBE) – Elliott Wave analysis – Daily chart
Function: Counter trend.
Mode: Corrective.
Structure: Flat Correction.
Position: Wave (Y) of {B}.
Direction: Downtrend.
Details: Expecting wave (B) to complete near the Wave III top around the 325–330 zone before moving into wave (C).
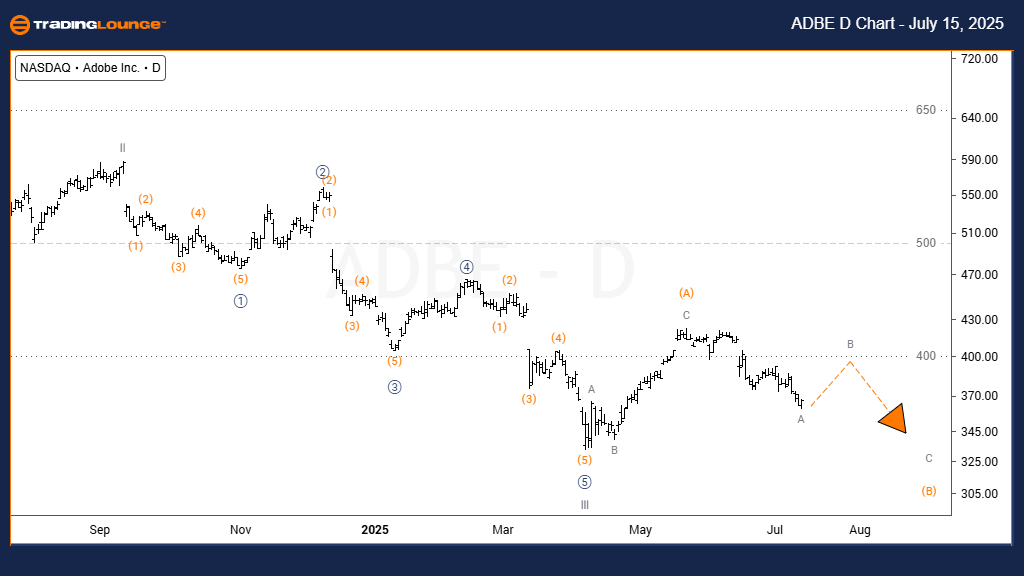
On the daily chart, Adobe Inc. (ADBE) is undergoing a flat correction as part of wave (Y) of {B}, following the completion of wave III. Since wave II formed a zigzag, the guideline of alternation suggests wave {B} will unfold as a flat or triangle.
Wave (A) of the flat appears complete, and the market is now advancing through wave (B), with expectations that it may terminate close to the previous high of wave III near the 325–330 level. This corrective structure aligns well with Elliott Wave rules, maintaining proportionality and supporting the flat pattern outlook.
Adobe Inc. (ADBE) – Elliott Wave analysis – Weekly chart
Function: Trend.
Mode: Motive.
Structure: Impulsive.
Position: Wave IV of (c).
Direction: Uptrend.
Details: The price is in wave IV of (c), forming a zigzag correction within a parallel channel before potentially continuing higher in wave V.
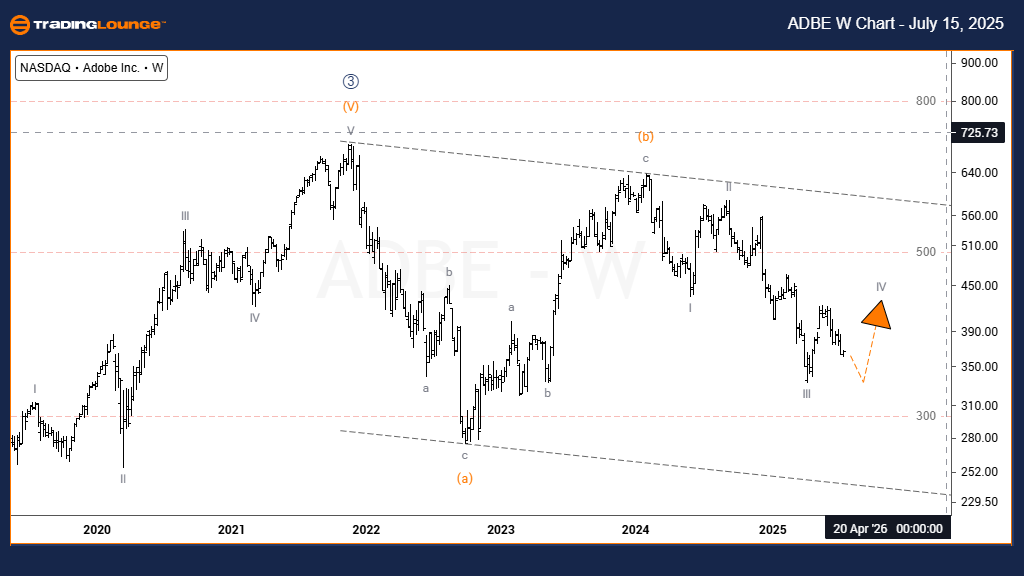
On the weekly chart, Adobe Inc. is correcting after a major upward impulsive wave. This correction is progressing in the form of a zigzag (a)-(b)-(c) and is consistent with classic Elliott Wave behavior. Waves (a) and (b) are completed, and the current price action represents wave (c), which is still unfolding.
Inside wave (c), the structure has reached wave IV, which is expected to develop further within a parallel channel. The broader trend remains bullish, and this temporary correction is part of a continuation setup for a longer-term uptrend.
Adobe Inc. (ADBE) Elliott Wave technical analysis [Video]
Author

Peter Mathers
TradingLounge
Peter Mathers started actively trading in 1982. He began his career at Hoei and Shoin, a Japanese futures trading company.


