AAPL rebounding from pullback to continue long-term bullish trend

After hitting a record high in December 2024, AAPL pulled back, retracing its bullish sub-cycle from January 2023. However, it has recovered more than half of the decline. The current rebound could reach a new high, but there is also a chance of a deeper double correction. In this blog post, we will explore both scenarios. We will also discuss how traders can find opportunities in either case.
Apple Inc. (AAPL) is a multinational technology company with headquarters in California. Founded in 1976 by Steve Jobs, Steve Wozniak, and Ronald Wayne. The company’s flagship products include the iPhone, Mac computers, iPad, Apple Watch, and AirPods. Apple also operates a robust ecosystem with services like the App Store, iCloud, Apple Music, and Apple Pay. With a strong brand, loyal customer base, and continuous advancements in technology, Apple remains one of the most valuable and influential companies in the world. It is publicly traded on the Nasdaq under the ticker symbol AAPL.
AAPL has remained in a long-term bullish trend, consistently rising from dips since its inception. The latest pullback began in December 2024, dropping 15% by January 2025. However, a strong recovery has followed. AAPL could be on track for a new high, but another leg lower is still possible, given the sharp decline in December. In this post, we will explore two potential scenarios and how traders can navigate them.
AAPL Elliott Wave analysis (1st scenario) – 17th February, 2025
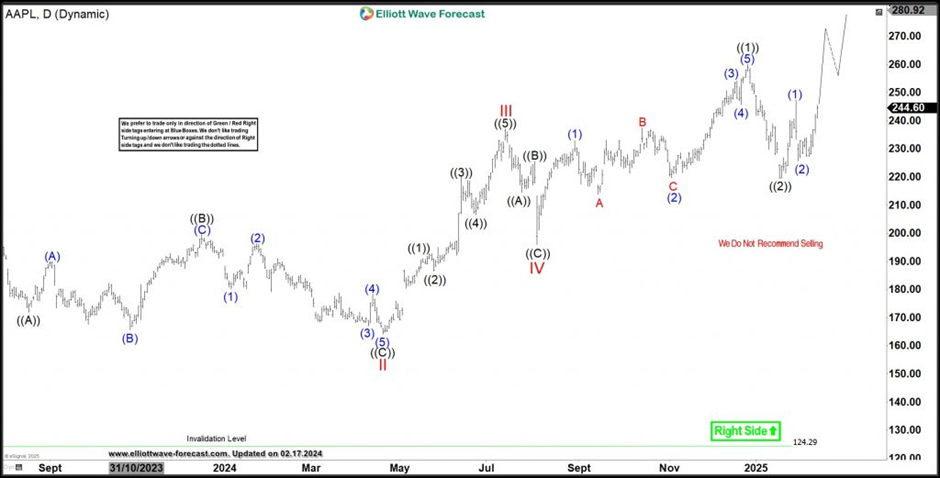
AAPL, Daily Chart
The daily chart above outlines AAPL’s long-term path. It suggests the stock is in wave V of (I) of ((III)) from the all-time low. Within wave V, sub-waves ((1)) and ((2)) are complete, and price is now in ((3)). If this wave count is correct, wave ((3)) of V should break to a new high and extend toward $299–$323. To confirm, price must breach the top of wave ((1)) with wave (3) of ((3)). However, given the sharp pullback in wave ((2)), there is a chance of a double zigzag (7-swing structure) from the top of ((1)). This alternate scenario would slightly change the chart structure.
Due to this possibility, traders should wait for price to break above wave ((1)) before looking for buying opportunities on the next pullback. Now, let’s examine the alternative scenario.
AAPL Elliott Wave analysis (2nd scenario) – 17th February, 2025
AAPL, Daily Chart
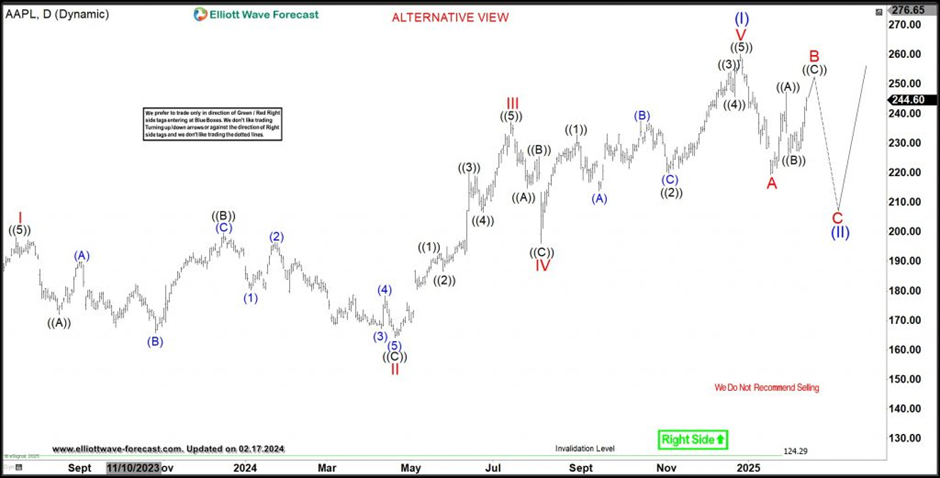
The alternative view suggests wave (I) may have completed with a I-II-III-IV-V diagonal structure, making the pullback from late December wave (II). This scenario remains valid if the current rally faces resistance below $260. In this case, buyers should wait for the end of wave C of (II), where at least a three-swing bounce is expected. We show our members the extreme zone for this purpose with the blue box on the chart.
Regardless of the scenario, we do not recommend selling AAPL. Instead, we prefer buying pullbacks—either at the end of wave (II) or after wave ((3)) is established above wave ((1)) high.
AAPL is one of 78 instruments we analyze at Elliottwave-Forecast, providing members with updates across all time frames, including H1 and 30-minute charts, multiple times daily.
Author

Elliott Wave Forecast Team
ElliottWave-Forecast.com


