Can Oil giant PetroChina accelerate higher?

PetroChina Company Limited is a Chinese oil and gas company and is the listed arm of the state- owned China National Petroleum Corporation (CNPC). Behind only Saudi Aramco and before another Chinese company Sinopec, it is the second largest worldwide in terms of revenue. Founded 1999, it is headquartered in Dongcheng District, Beijing, China. International investors can trade it under the ticker $0857 at HKEX. The company is a part of Hang Seng index. Also, one can trade PetroChina under the ticker $PCCYF in US in form of ADRs. Today, PetroChina is employing more than 506’000 people serving worldwide with primary markets in China.
Oil and Gas prices have found their bottom in April and June 2020, respectively. Then, an important rally towards March and August 2022 highs, respectively, has taken place. Now, from the peaks, a consolidation is taking place and should find another bottom soon. Indeed, oil prices are trading within daily buying area. Natural gas is lagging and can reach the respective buying area as well. On the other hand, major indices may have found a bottom from November 2021/January 2022 highs already. Last not least, Hang Seng index is reacting already higher out of weekly bluebox ending a 5 year correction from January 2018 highs. It is obvious, that energy stocks should be supported owing to rising prices of oil and gas and also due to the next bullish cycle in indices. Will this coincidence allow PetroChina to find a bottom and accelerate higher?
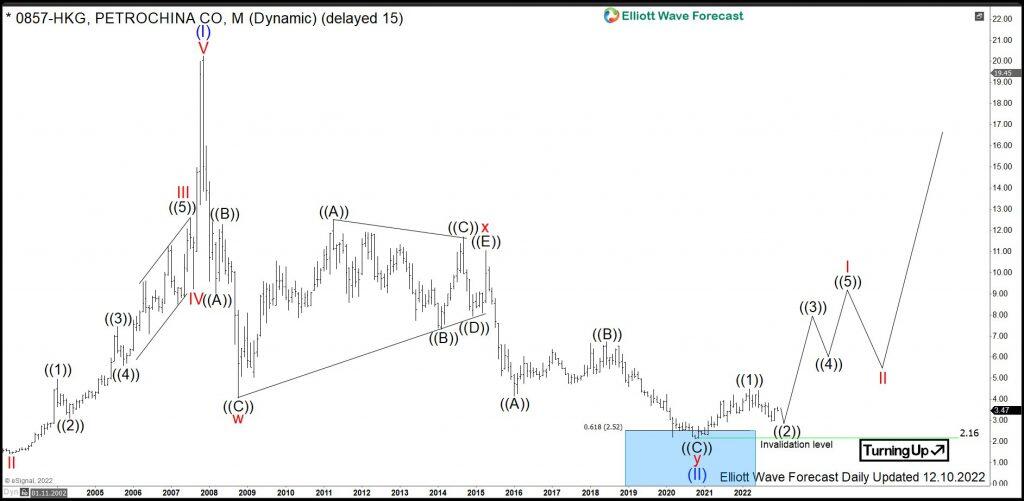
PetroChina monthly Elliott Wave analysis 12.11.2022
The monthly chart below shows thePetroChina shares $0857 traded at HKEX. From the IPO in 2002, the stock price has developed an initial cycle higher in blue wave (I) of super cycle degree towards 20.25 all-time highs in November 2007. After an impulsive structure higher, a correction lower in blue wave (II) has unfolded as an Elliott wave double three pattern. Firstly, red wave w of blue wave (II) has printed a low at 4.05 in October 2008. Then, a triangle structure in red wave x has ended at 11.04 highs in April 2015. Later on, the price has broken 4.05 lows opening up a bearish sequence. As a consequence, red wave y should find support lower from 100% extension. However, that extension is negative which is impossible. Therefore, 61.8% extension being 2.52-0.00 area can serve as a next supporting range where a new cycle higher should start. Indeed, the red wave y of blue wave (II) has finished in October 2020 at 2.16.
While above October 2020 lows, a new bullish cycle in blue wave (III) might have started and is now in the initial stages. Long-term, the target for blue wave (III) will be 22.41-34.92 area and even higher.
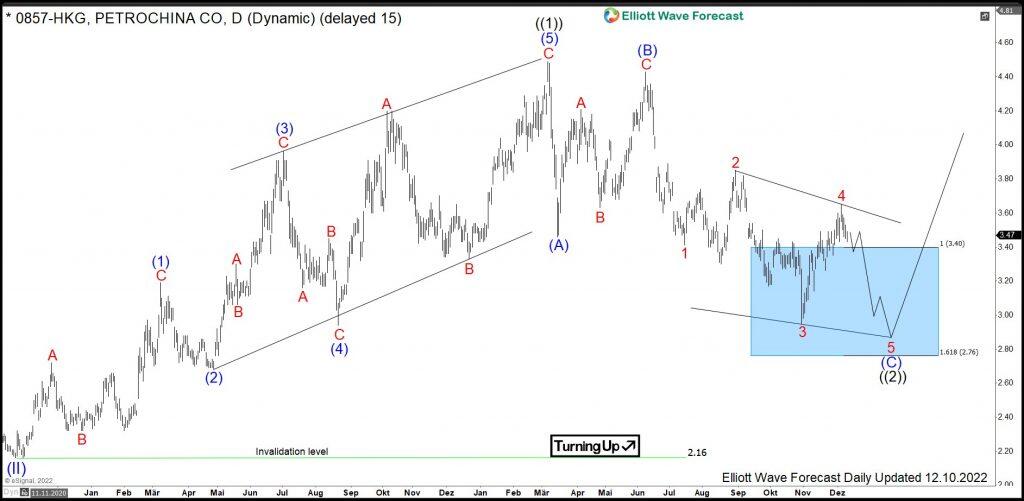
PetroChina daily Elliott Wave analysis 12.11.2022
The daily chart below shows in more detail the initial nest consisting of black waves ((1))-((2)) in more detail. From the October 2020 lows, black wave ((1)) of red wave I has ended in March 2022. It has the pattern of a leading diagonal being a 3-3-3-3-3 structure. From the 4.49 highs, correction in wave ((2)) should provide an opportunity for an acceleration higher in black wave ((3)). It unfolds as a zigzag pattern. Firstly, from the March 2022, an impulse lower of blue (A) have set a low at 3.74 of the same month. Secondly, a bounce in blue wave (B) has printed a connector high at 4.43. Thirdly, the price reached lower into the blue box extension area 3.40-2.76. From there, a new cycle in black wave ((3)) should start. Technically, one more swing can take place to complete the structure of the blue wave (C). Then, expect acceration in black wave ((3)) towards 4.49 and beyond to take place.
Investors and traders can be using 3.40-2.76 bluebox area as a buying opportunity in $0857 targeting 22.41-34.92 area and even higher in the long run.
Author

Elliott Wave Forecast Team
ElliottWave-Forecast.com


