• Zilliqa price bounces over 100% from the May 23 low, but volume lags.
  • 200-day simple moving average (SMA) has played a role of support or resistance over the previous seven days.
  • ZIL daily Relative Strength Index (RSI) reached the most oversold reading since March 2020.

Zilliqa price has stalled at the May declining trend line after setting the framework for a double bottom on the daily chart. Volume has not been cooperative during the rebound, suggesting that a pullback or pause is necessary to refresh ZIL after the 100% bounce from the May 23 low.

Zilliqa price boasts clear points of support for any future weakness

Zilliqa price declined over 70% from the all-time high at $0.262 to the May 23 low at $0.069. The decline followed several failed attempts to overcome the 2018 high at $0.235, resulting in a double top pattern that triggered on May 19 with a fall below $0.115.

ZIL briefly identified support at the 40-week SMA, the March 2020 rising trend line and the 23.6% Fibonacci extension of the advance beginning in March 2020 at $0.085, before finally bottoming at $0.069.

Moving forward, the price range defined by the May declining trend line, currently at $0.140, and the 200-day SMA at $0.113 should contain Zilliqa price over the next few days and provide the base for higher prices.

A successful ZIL breakout above May’s declining trend line and the 61.8% retracement of the May correction at $0.155 would trigger the double bottom pattern and set Zilliqa price on the path to test the declining 50-day SMA at $0.183 and then the 78.6% retracement at $0.194.

As was the case in April and early May, the 2018 high at $0.235 will interrupt the rally. A daily close above the all-time high at $0.262, representing a 120% gain from price at the time of writing, would confirm the resistance has been solved, and Zilliqa price can begin a sustainable advance into new highs.
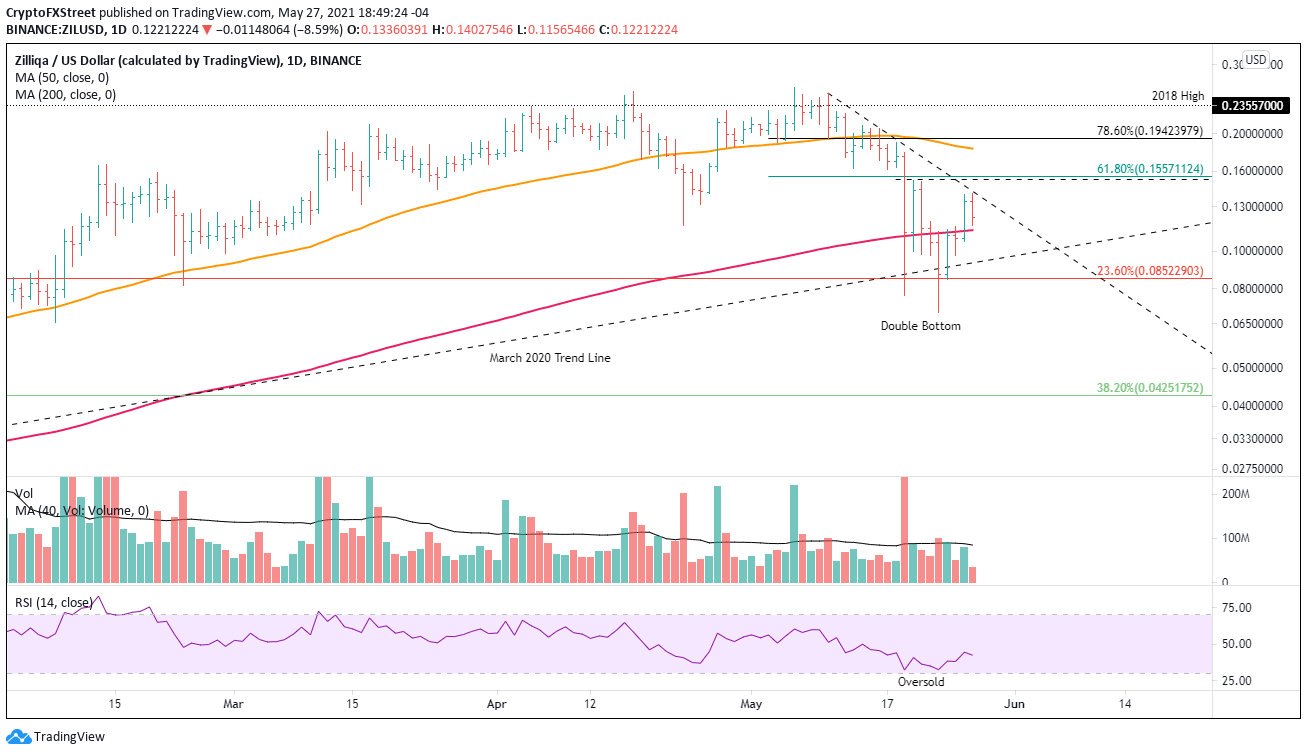
ZIL/USD daily chart

ZIL/USD daily chart

An acceleration of selling pressure below the 200-day SMA would instigate a test of the March 2020 rising trend line at $0.094. A failure to hold the trend line would push ZIL to the 23.6% retracement at $0.085. 

Any further weakness would signify that Zilliqa price is entering a new phase for the correction that could push ZIL to test the 38.2% retracement of the advance beginning in March 2020 at $0.042.


Note: All information on this page is subject to change. The use of this website constitutes acceptance of our user agreement. Please read our privacy policy and legal disclaimer. Opinions expressed at FXstreet.com are those of the individual authors and do not necessarily represent the opinion of FXstreet.com or its management. Risk Disclosure: Trading foreign exchange on margin carries a high level of risk, and may not be suitable for all investors. The high degree of leverage can work against you as well as for you. Before deciding to invest in foreign exchange you should carefully consider your investment objectives, level of experience, and risk appetite. The possibility exists that you could sustain a loss of some or all of your initial investment and therefore you should not invest money that you cannot afford to lose. You should be aware of all the risks associated with foreign exchange trading, and seek advice from an independent financial advisor if you have any doubts.

Join Telegram

Recommended content


Recommended Content

Editors’ Picks

Ripple wipes out weekly gains, experts comment on role of Ripple stablecoin

Ripple wipes out weekly gains, experts comment on role of Ripple stablecoin

Ripple declined to $0.52 on Thursday, erasing all gains registered earlier this week. Ripple SVP Eric van Miltenburg’s comments on the firm’s stablecoin, and how it is expected to benefit the XRP Ledger and native token XRP have raised concerns among crypto experts. 

More Ripple News

Hedera HBAR slips nearly 10% after air is cleared on mistaken link with giant BlackRock

Hedera HBAR slips nearly 10% after air is cleared on mistaken link with giant BlackRock

HBAR price is down nearly 10% on Thursday, partly erasing gains inspired by the misinterpreted link with BlackRock. Despite the recent correction, Hedera’s price is up 44% in the past seven days.

More Hedera News

The reason behind Bonk’s 105% rise and if you should buy now Premium

The reason behind Bonk’s 105% rise and if you should buy now

Bonk price has shot up 105% in the past five weeks. A retracement into $0.0000216 or the $0.0000152 to $0.0000186 imbalance would be a good buying opportunity. Patient investors can expect double-digit gains from BONK that could extend up to 70%.

More Cryptocurrencies News

Injective price weakness persists despite over 5.9 million INJ tokens burned

Injective price weakness persists despite over 5.9 million INJ tokens burned

Injective price is trading with a bearish bias, stuck in the lower section of the market range. The bearish outlook abounds despite the network's deflationary efforts to pump the price. Coupled with broader market gloom, INJ token’s doomed days may not be over yet.

More Injective News

Bitcoin: BTC post-halving rally could be partially priced in Premium

Bitcoin: BTC post-halving rally could be partially priced in

Bitcoin (BTC) price briefly slipped below the $60,000 level for the last three days, attracting buyers in this area as the fourth BTC halving is due in a few hours. Is the halving priced in for Bitcoin? Or will the pioneer crypto note more gains in the coming days? 

Read full analysis

BTC

ETH

XRP