Zcash Price Forecast: ZEC extends decline as retail demand steadies
- Zcash trims gains and holds the 50-day EMA amid heightened volatility in the broader cryptocurrency market.
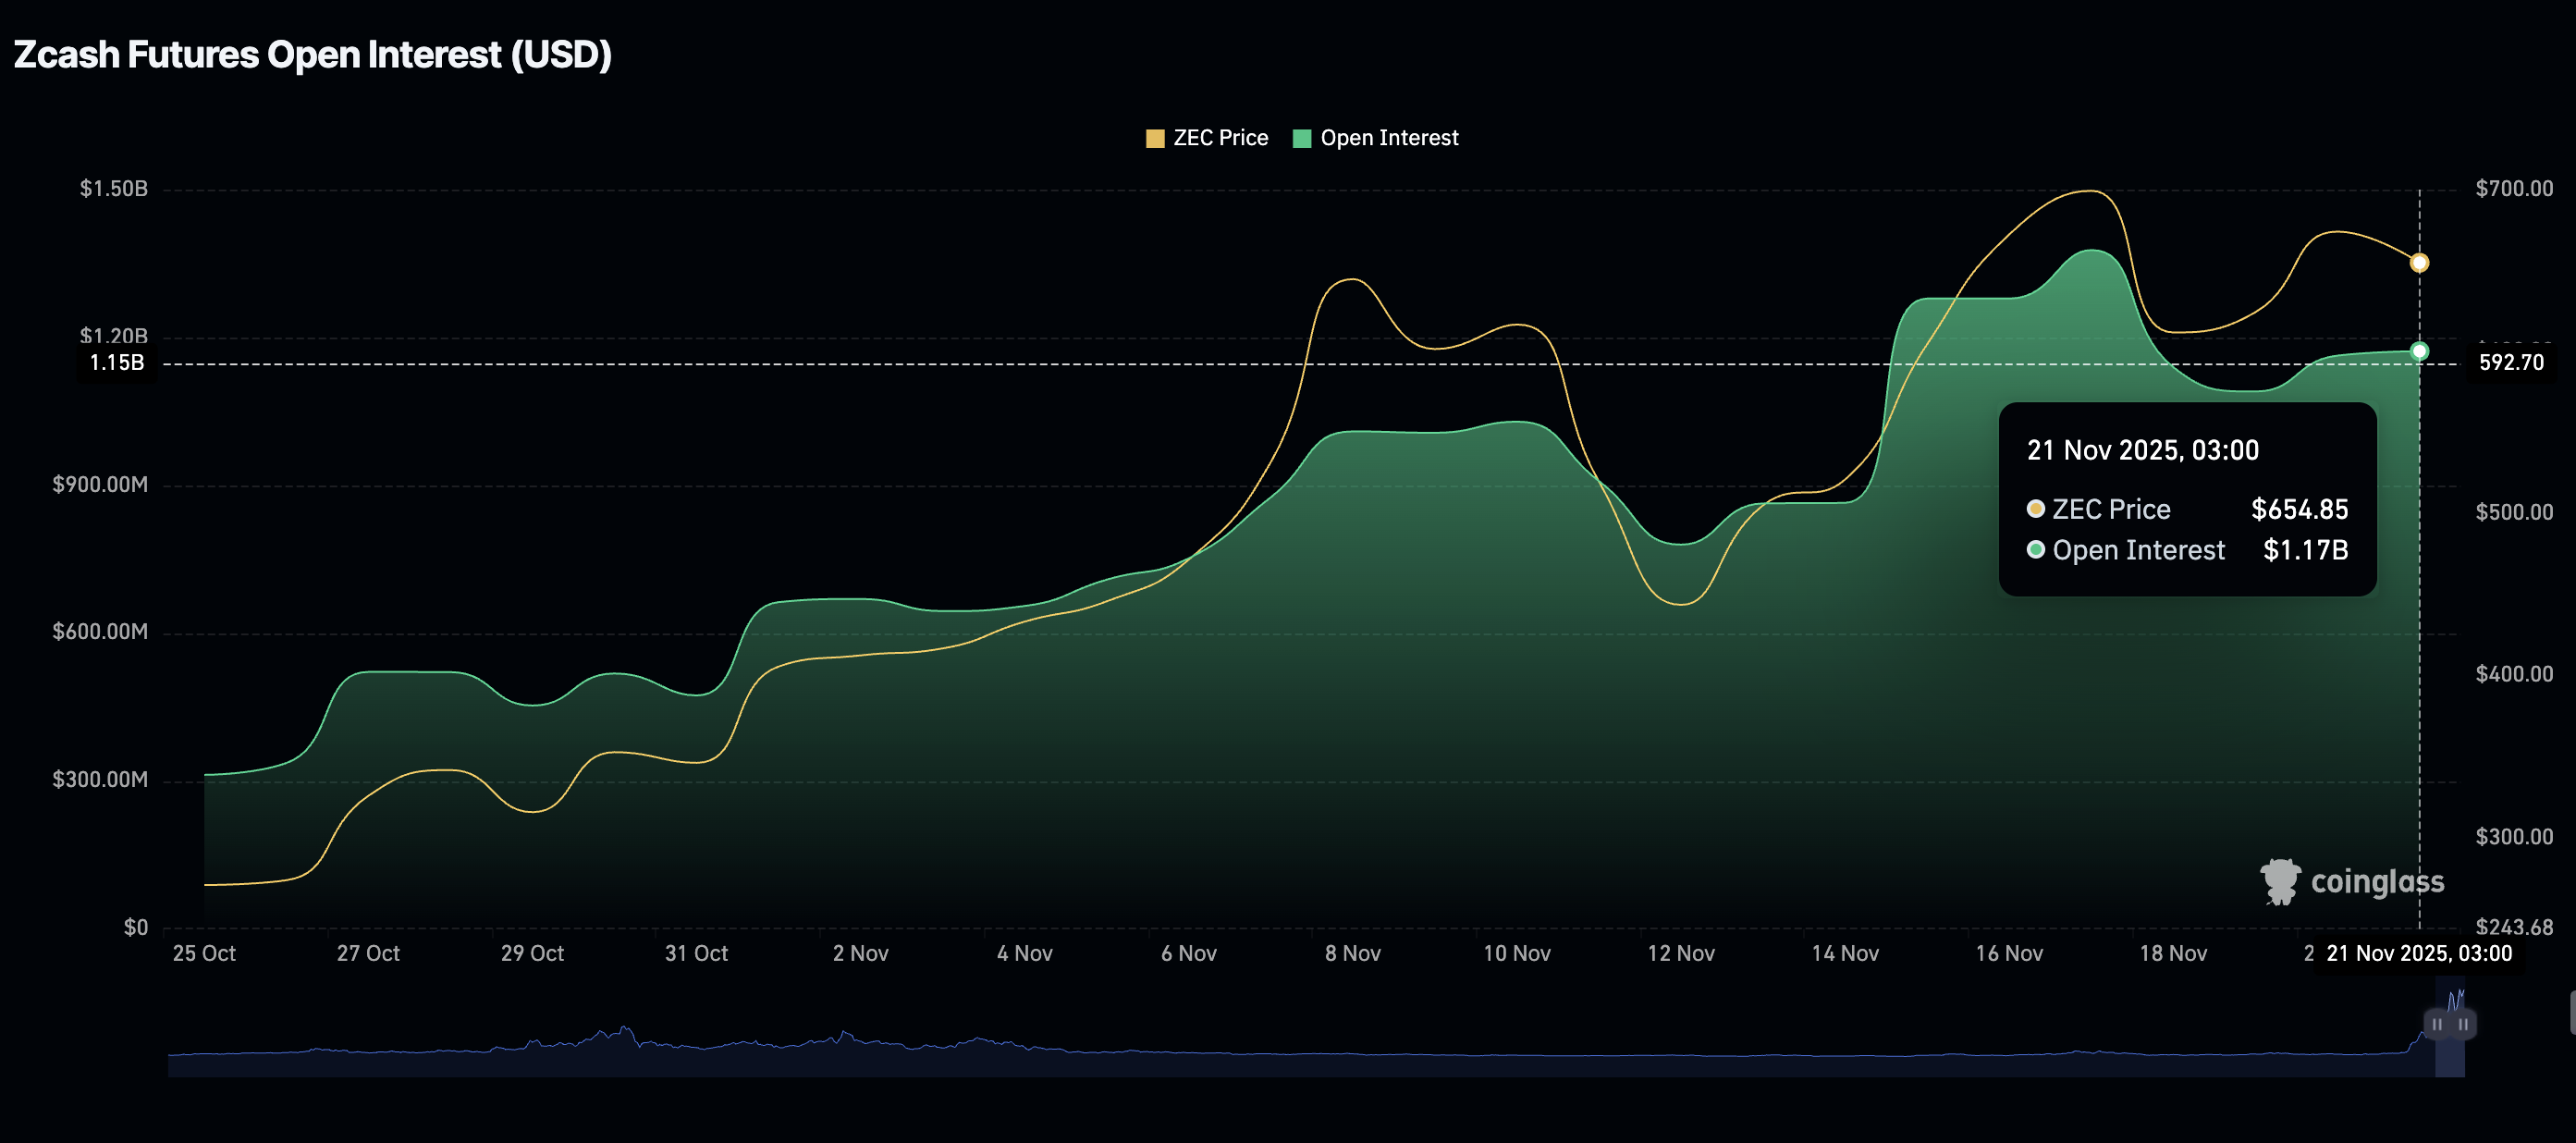
- ZEC derivatives market stabilizes with futures Open Interest above $1 billion.
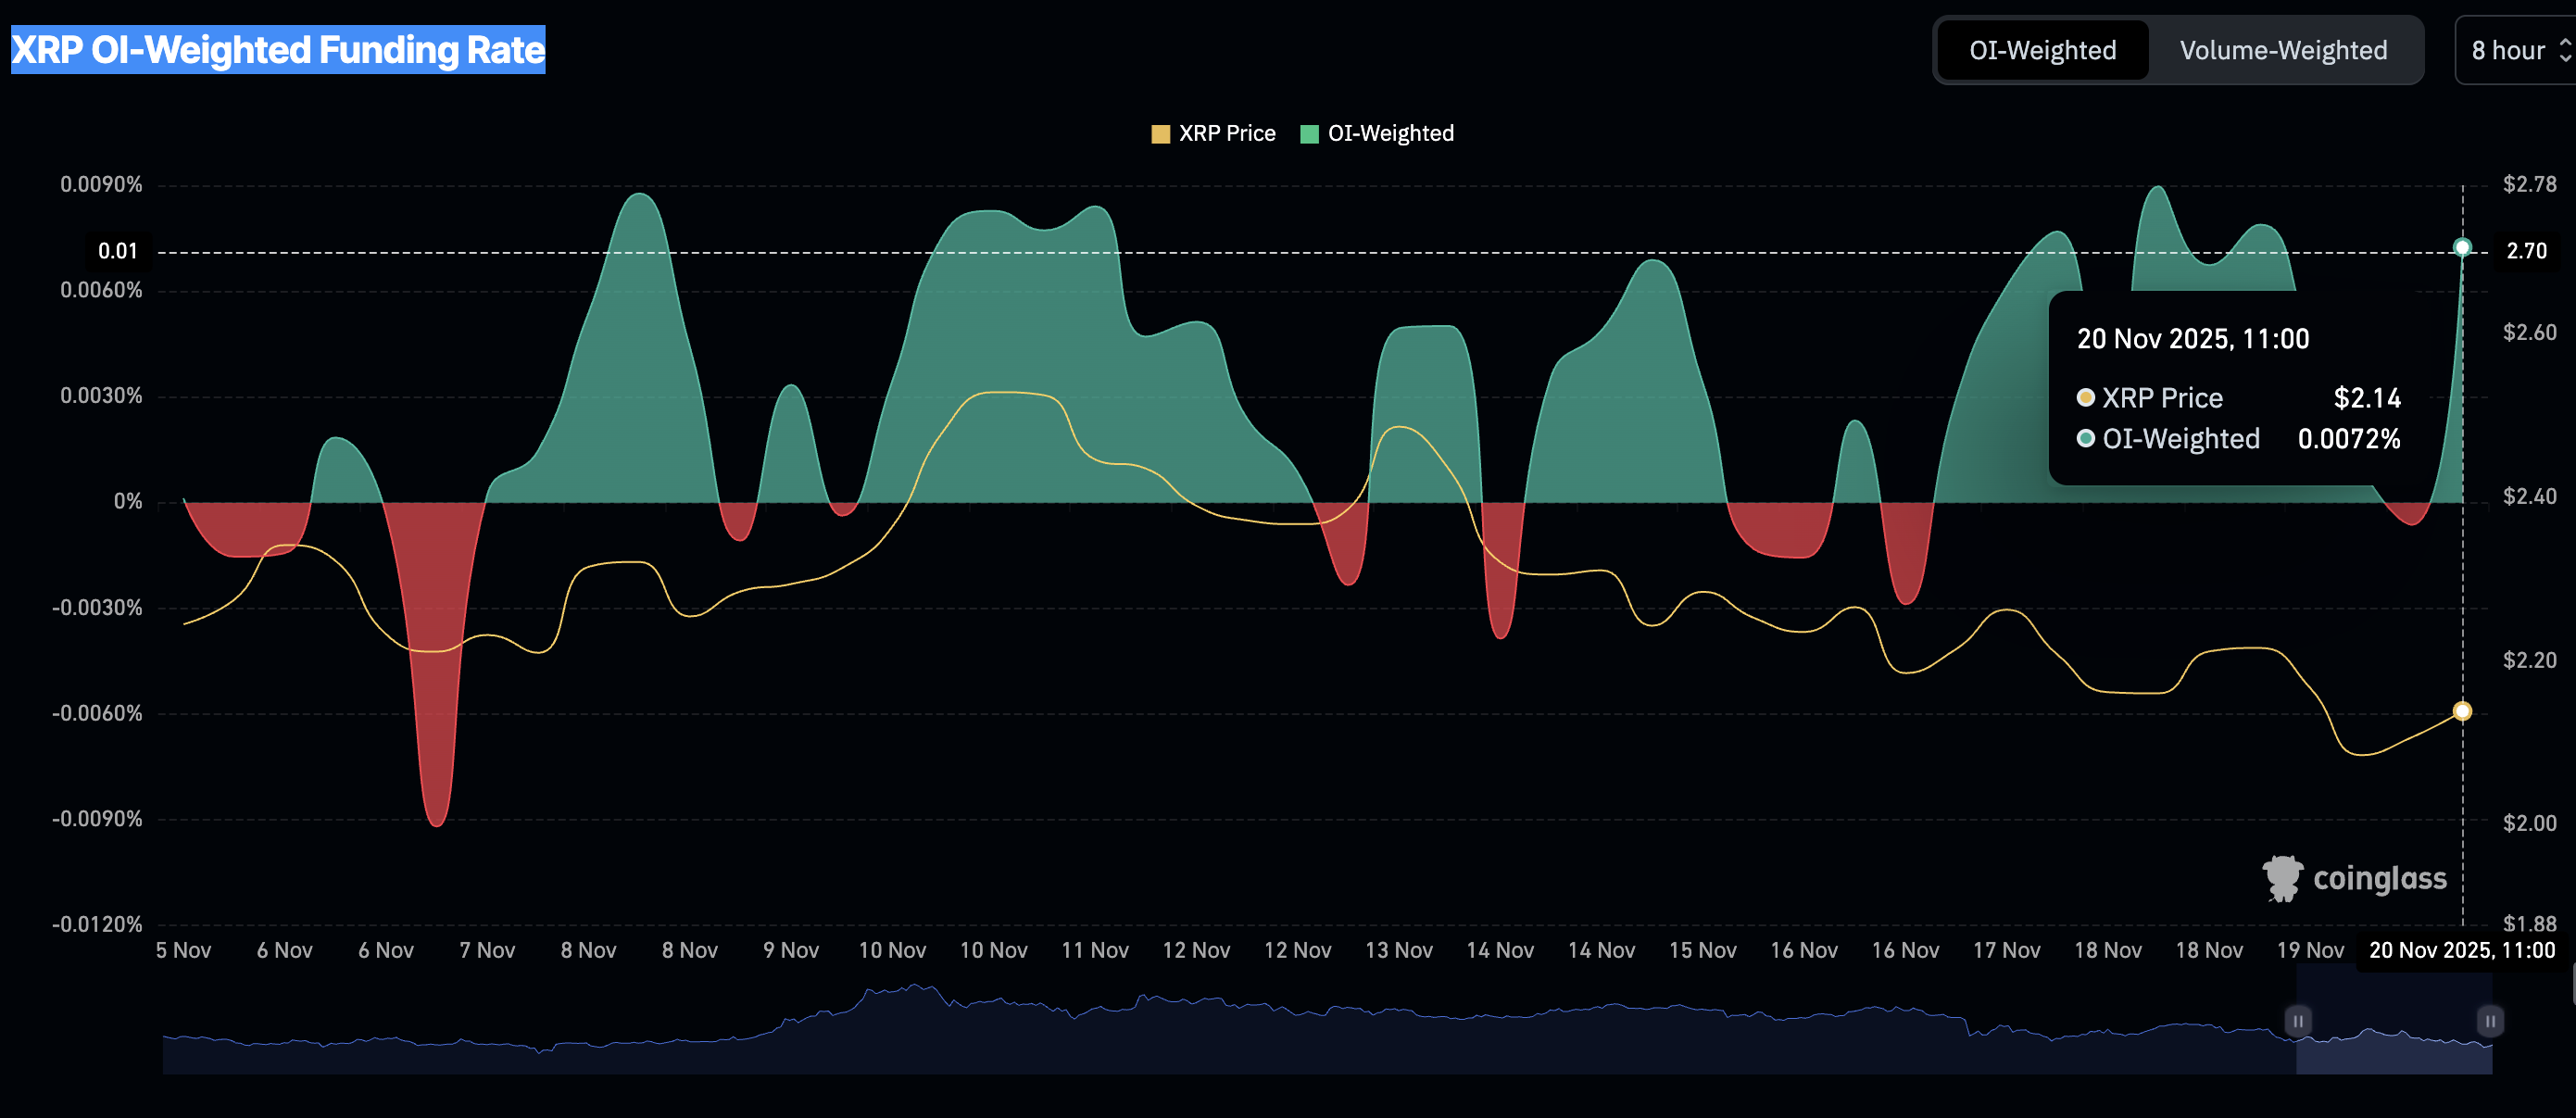
- Zcash OI-Weighted Funding Rate remains in the negative zone for three consecutive days, as traders pile into short positions.

Zcash (ZEC) is trading above $630 at the time of writing on Friday, after extending its intraday decline to $595. Despite ZEC's correction from a heavy supply zone at $700, the privacy-oriented token is showing signs of stability, which could see it regain momentum heading into the weekend.
Zcash retail demand stabilizes, fuelling optimism for a rebound
Zcash derivatives have extended their rebound, with futures Open Interest (OI) stabilizing above the $1 billion on Friday. OI, representing the notional value of outstanding futures contracts, must steadily rise, signaling growing trader optimism and risk appetite. The coming days will help gauge sentiment, with higher OI backing an extended rebound toward $700.
However, if retail demand narrows and OI drops, the path of least resistance could remain to the downside, increasing the likelihood of losses below $600.
Investors should temper their bullish expectations, particularly given Zcash Futures Open Interest, which has remained in negative territory for three consecutive days. Dips below the zero line suggest that traders are leaning bearishly, reducing their risk exposure while piling into short positions.
Technical outlook: Zcash holds key support
Zcash is trading at around $630 and sits below Friday's opening price of $655. The privacy-focused token holds above the 50-period Moving Average (EMA) at $624, the 100-period EMA at $574 and the 200-period EMA at $478 on the four-hour chart, with all three edging higher, keeping the short-term bias positive.
The Moving Average Convergence Divergence (MACD) indicator edges lower as the blue line slips below the red signal line and the zero mark, pointing to increasing bearish momentum. Similarly, the Relative Strength Index (RSI) at 47 remains neutral-to-soft, reflecting fading momentum.
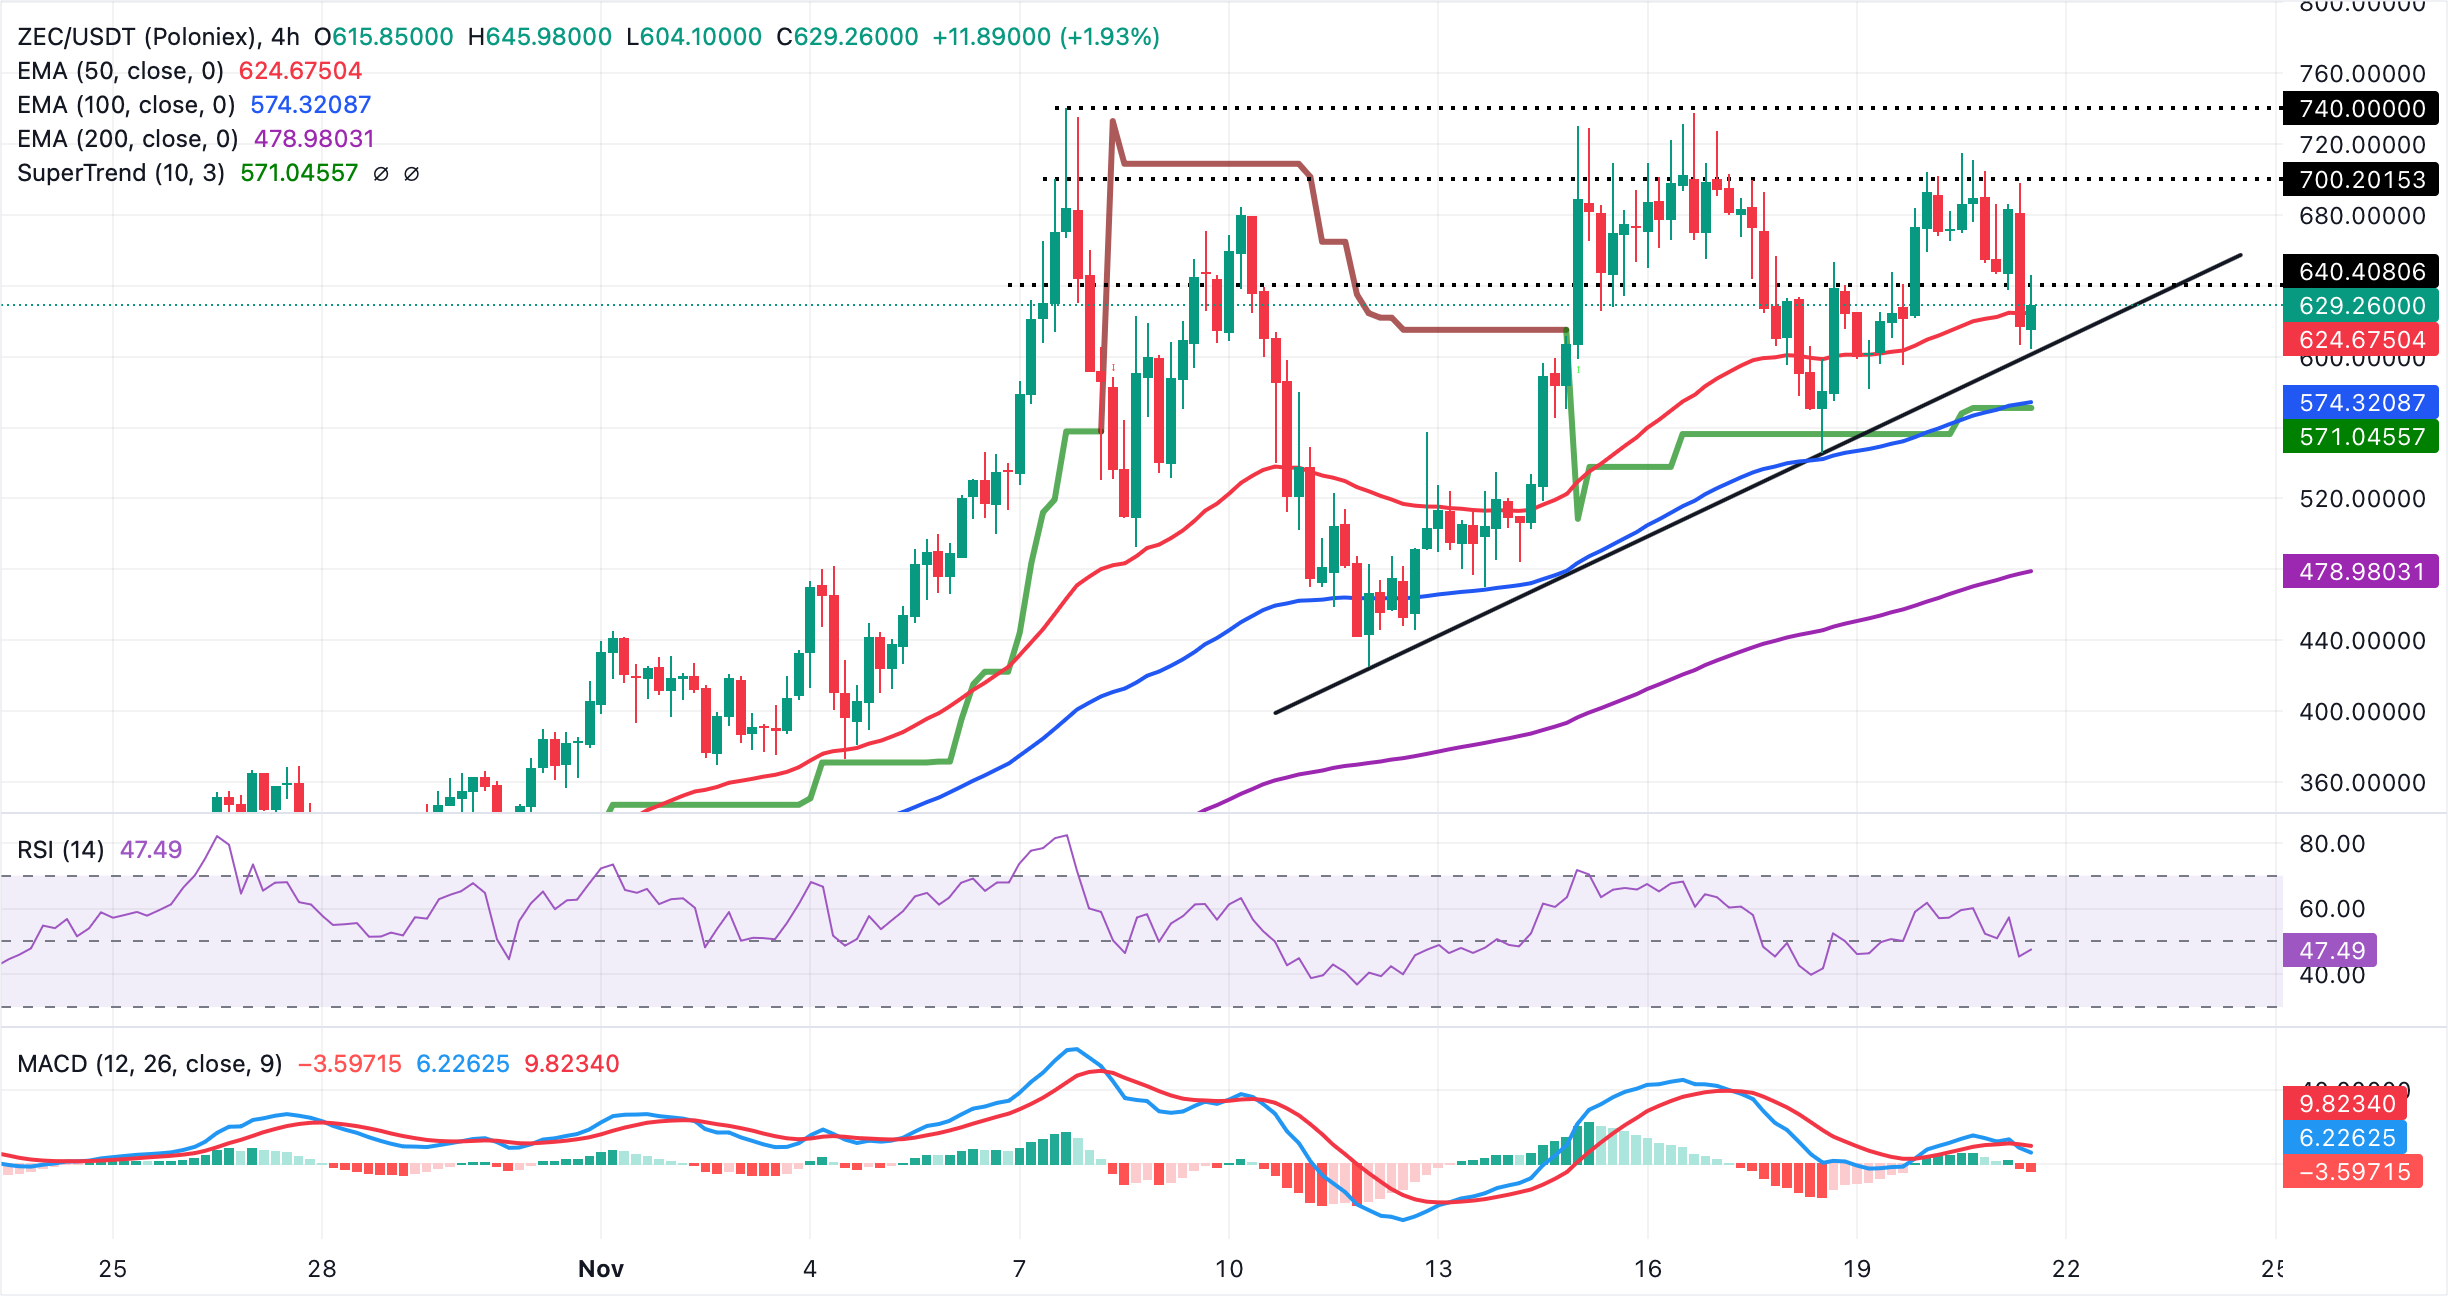
The rising trend line from $398 underpins the uptrend, offering support near $604. Meanwhile, the SuperTrend trails Zcash at $571, highlighting a secondary support. A close below the trendline could open a deeper pullback toward the trailing stop, whereas a recovery through $648 would ease downside pressure and refocus the topside toward $700.
Open Interest, funding rate FAQs
Higher Open Interest is associated with higher liquidity and new capital inflow to the market. This is considered the equivalent of increase in efficiency and the ongoing trend continues. When Open Interest decreases, it is considered a sign of liquidation in the market, investors are leaving and the overall demand for an asset is on a decline, fueling a bearish sentiment among investors.
Funding fees bridge the difference between spot prices and prices of futures contracts of an asset by increasing liquidation risks faced by traders. A consistently high and positive funding rate implies there is a bullish sentiment among market participants and there is an expectation of a price hike. A consistently negative funding rate for an asset implies a bearish sentiment, indicating that traders expect the cryptocurrency’s price to fall and a bearish trend reversal is likely to occur.
(The technical analysis of this story was written with the help of an AI tool)
Author

John Isige
FXStreet
John Isige is a seasoned cryptocurrency journalist and markets analyst committed to delivering high-quality, actionable insights tailored to traders, investors, and crypto enthusiasts. He enjoys deep dives into emerging Web3 tren


