Yearn.finance Price Prediction: YFI hunts for a bottom as $10,000 beckons
- Yearn.finance retraces by more than 20% in 24 hours amid widespread losses across the DeFi sector.
- YFI could soon lose the 'most expensive' cryptocurrency status, especially if declines continue towards $10,000.
- On-chain metrics suggest that a period of consolidation is in the offing.

The decentralized finance (DeFi) ecosystem has been wallowing in losses over the past several weeks. According to Santiment, a leading provider of on-chain data, the total market capitalization of the DeFi ecosystem has plummeted by 25% in the last 24 hours alone. Moreover, a 30% decline in trading volume was also incurred in the same period. Some of the tokens that are leading in the freefall include Yearn.finance (YFI), Sushi (SUSHI) and Serum (SRM).
Yearn finance plunges to $12,000
Yearn.finance is still holding onto the status of being the most expensive cryptocurrency in the industry. However, with the rate at which its value is falling, that may not stand for long. On the other hand, Bitcoin is exchanging hands at $10,600, eager to regains its status.
The DeFi token soared to all-time highs of $44,000 as reported. The massive rally was mainly attributed to the support the token received on global exchanges such as Binance and Coinbase. However, the volume started to reduce alongside the price of the token. Declines have been following the confines of a descending parallel channel, as illustrated on the 12-hour chart.
YFI/USD 12-hour chart
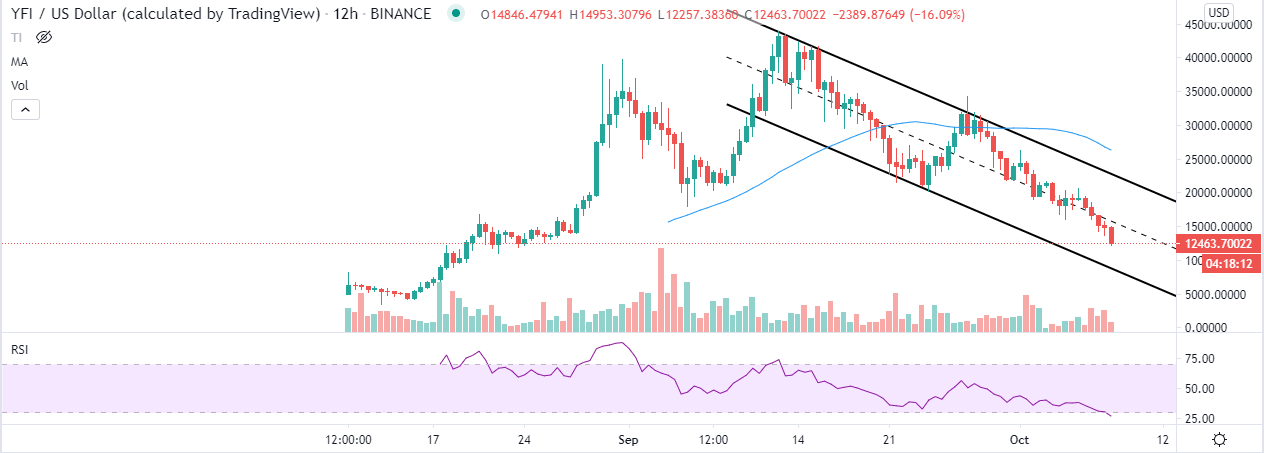
YFI/USD is doddering at $12,600 after the channel's middle boundary was shattered as support. The Relative Strength Index (RS) highlights the sellers' immense presence following its sharp drop into the oversold area. The hunt for formidable support is in full swing, but the declines' momentum suggests that $10,000 could soon be tested.
IntoTheBlock's IOMAP model shows intensifying resistance towards $14,000. Most of the buying pressure building from the prevailing price level is likely to fizzle out in these zones. The most robust resistance lies in the region between $13,215 and $13,600. Here, 83 addresses bought roughly 54 YFI.
YFI IOMAP chart
-637377437546066728.png)
On the downside, YFI is holding above a region of immense support highlighted between $12,108 and $12,449. Here, 180 addresses previously purchased approximately 62 YFI. If the bears slice through this support, the next range would be support between $10,577 and $10,960.
The "New Daily addresses" metric shows a slight increase in the number of new addresses joining the YFI network. Following a drop to 476 addresses on October 6, they increased to 740 on October 7. In other words. The uptrend is signaling a potential growth in the coming days. Usually, sustained network growth is a leading indicator of improving prices. Therefore, for YFI to continue with the uptrend, the new addresses joining the network must increase, simultaneously improving inflow and liquidity.
YFI/USD new addresses chart
-637377438677503278.png)
Looking at the other side of the picture
It is worth mentioning that the bearish outlook could be invalidated if YFI holds above $12,000 or the support highlighted by the IOMAP model between $12,108 and $12,449. If the new addresses joining the network continue with the run upwards, improved inflow and liquidity will point to growth in the token value. Moreover, if the descending parallel channel can confirm a bull flag, then a reversal will come into the picture, sending Yearn.finance above $20,000.
Author

John Isige
FXStreet
John Isige is a seasoned cryptocurrency journalist and markets analyst committed to delivering high-quality, actionable insights tailored to traders, investors, and crypto enthusiasts. He enjoys deep dives into emerging Web3 tren


