|

Yearn Finance Price Prediction: YFI must hold $13,000 to avoid steep correction

  • YFI is bounded inside a descending triangle pattern.
  • Bulls need to hold critical support level at $13,000 to avoid a significant pullback.

Despite the bullish momentum of the entire crypto market, it seems that YFI hasn’t benefited from it, being down 16% since October 24. The digital asset is currently trading at $13,153 and shows almost no signs of recovery. 

Slipping below $13,000 can drive YFI towards $8,600

The lower trendline at $13,000 of the descending triangle pattern formed on the 4-hour chart has acted as strong support several times in the past since October 8. A break below that level would be significant for the sellers.

yfi price

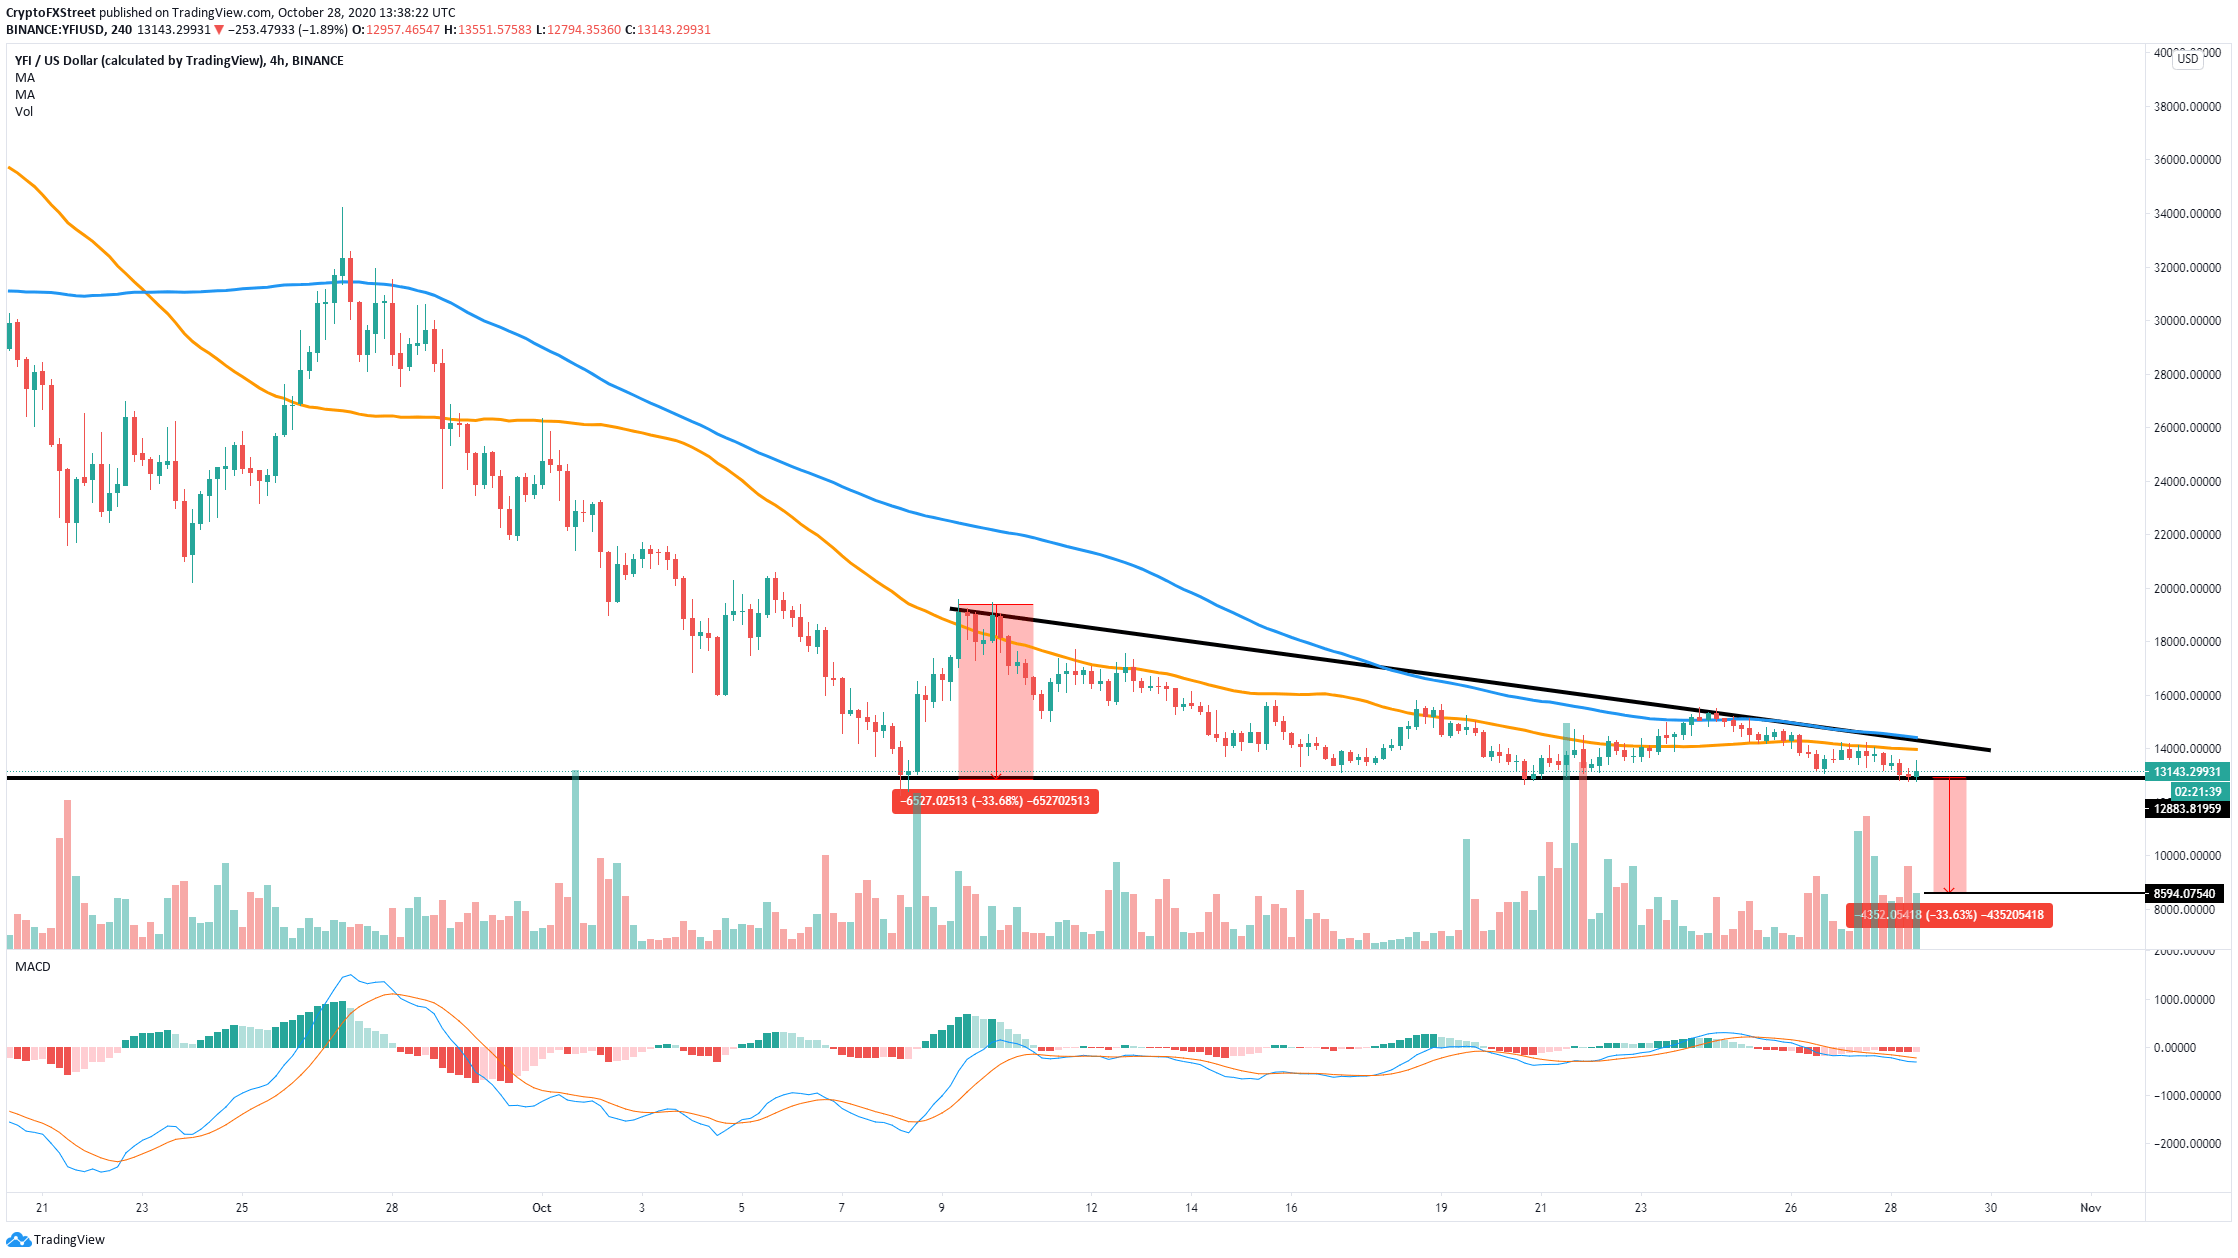
YFI/USDT 4-hour chart

The MACD remains bearish and started to gain momentum again. The length from the top of the triangle to the lower trendline can be used as a price target for the bears. In this case, it seems that YFI could drop as far as $8,600.
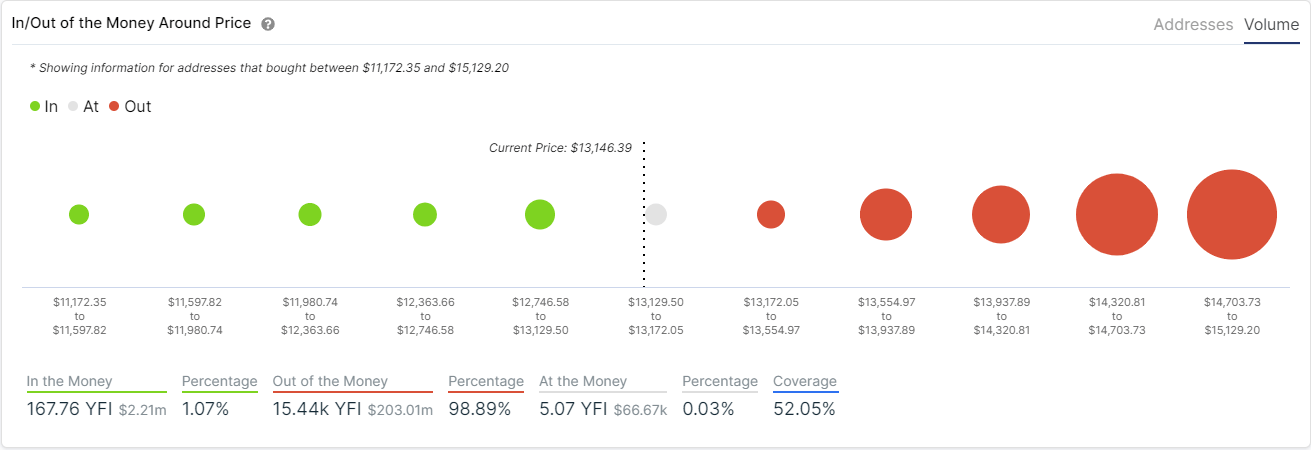
yfi price

YFI IOMAP chart

Furthermore, the In/Out of the Money Around Price shows very little support on the way down from $13,129 until $11,172. In comparison, resistance is far more substantial as a higher number of investors bought additional YFI tokens on the way up.

A positive sign for YFI bulls

On the other hand, it seems that the TD Sequential indicator is about to present a strong buy signal on the 12-hour chart. Successfully defending the robust support trendline of the descending triangle pattern could drive the price of YFI towards the upper resistance at $14,100. 

yfi price

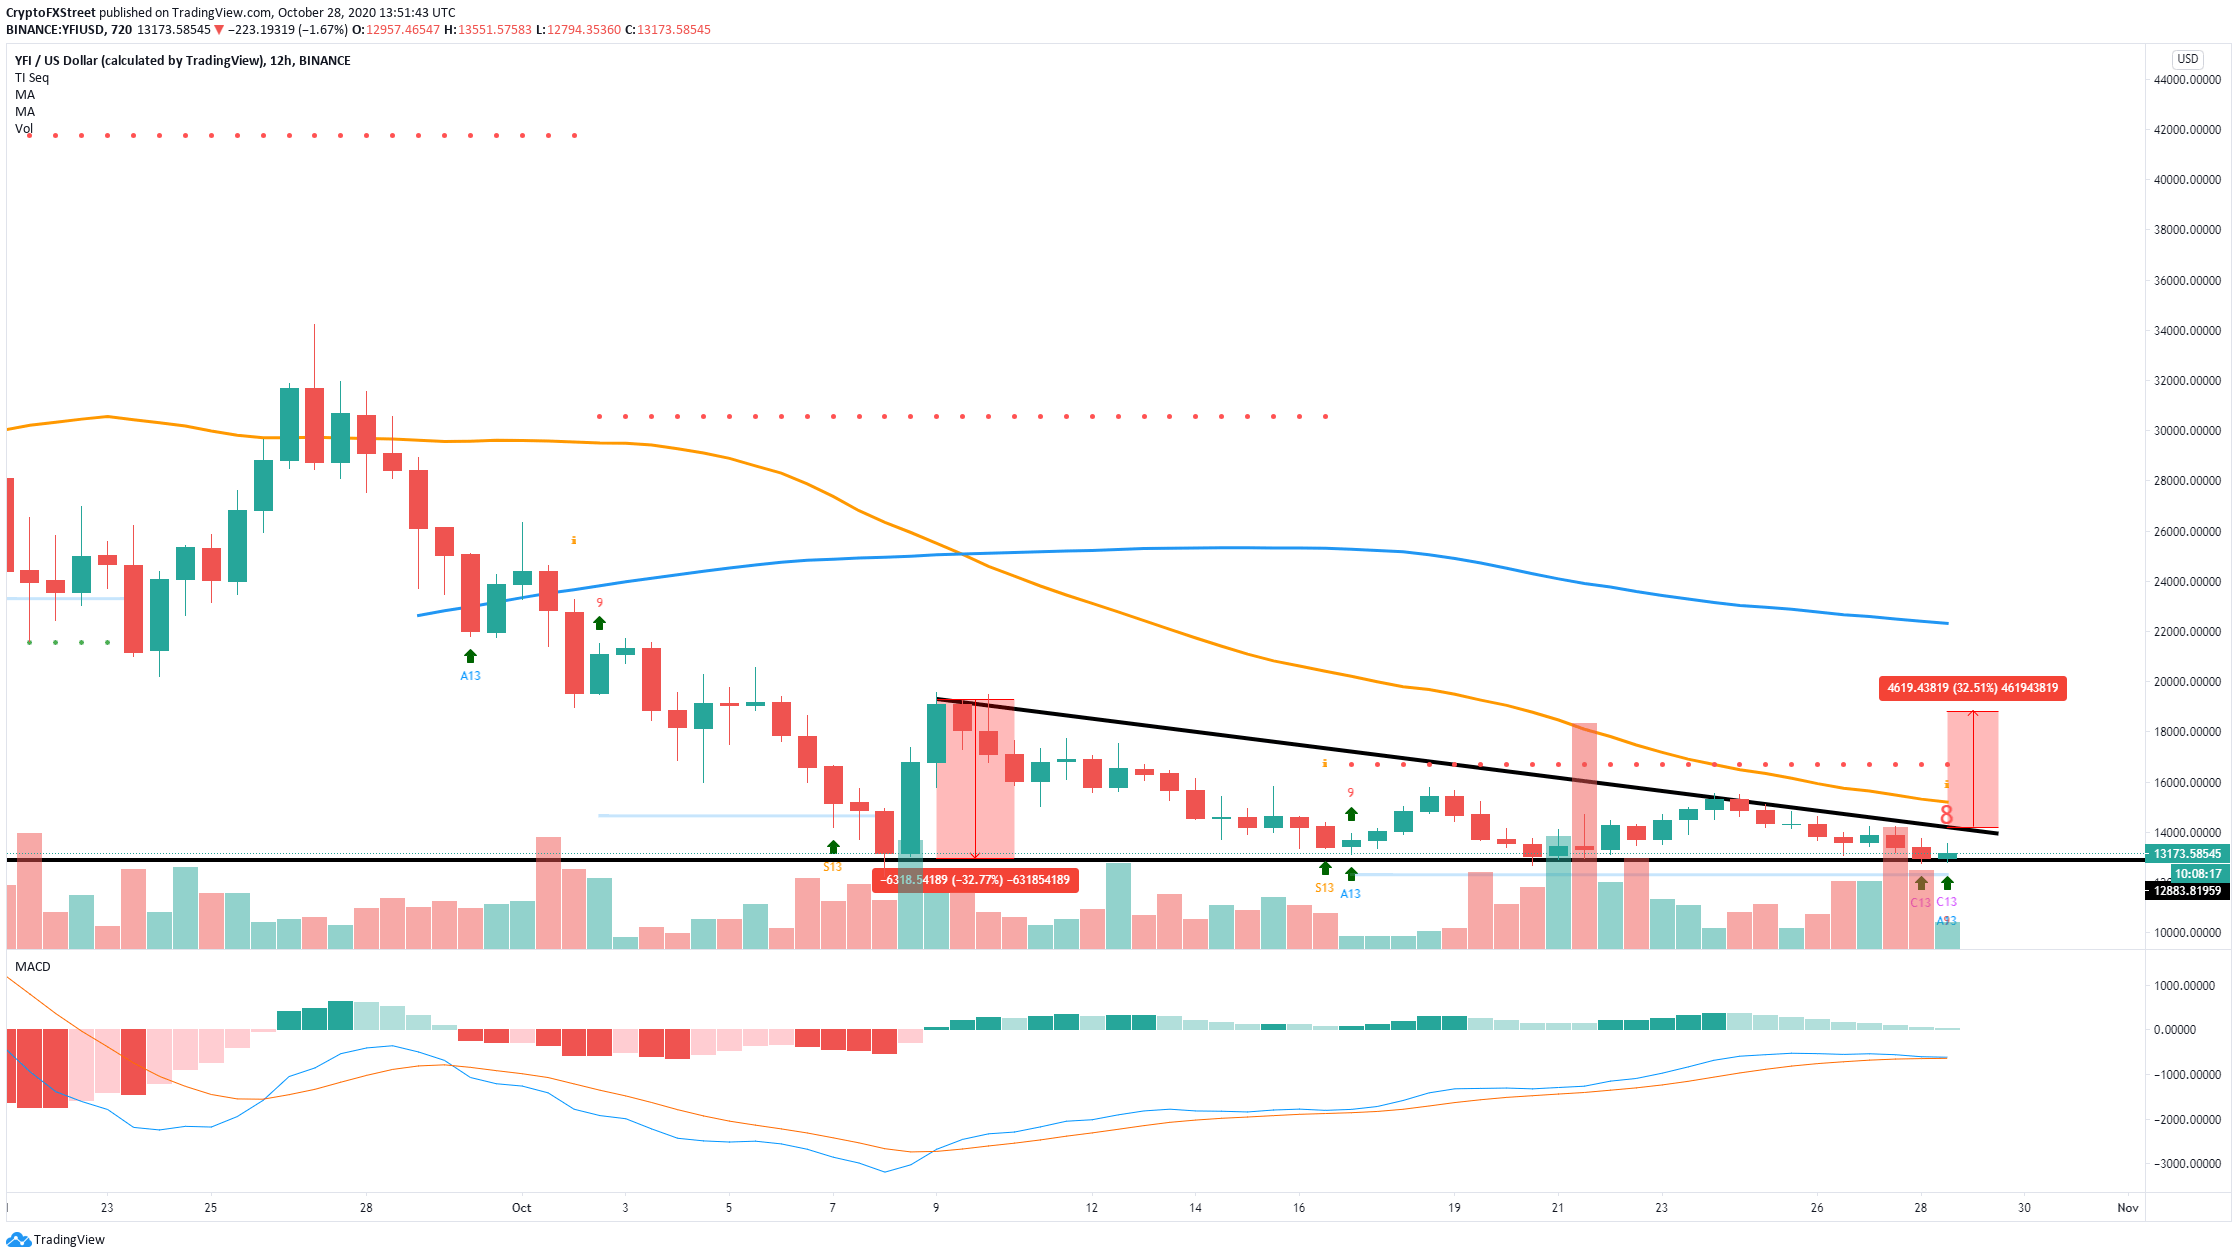
YFI/USDT 12-hour chart

A breakout above $14,100 can push the digital asset towards the 50-SMA at $15,222 on the 12-hour chart. A longer-term price target could be almost $19,000, representing a 32% price jump from the triangle pattern.  

Author

Lorenzo Stroe

Lorenzo Stroe

Independent Analyst

Lorenzo is an experienced Technical Analyst and Content Writer who has been working in the cryptocurrency industry since 2012. He also has a passion for trading.

More from Lorenzo Stroe
Share:

Editor's Picks

Top 3 Price Prediction: Bitcoin, Ethereum, Ripple deepen sell-off as bears take control of momentum

Bitcoin, Ethereum, and Ripple continued their corrections on Friday, posting weekly losses of nearly 6%, 3%, and 5%, respectively. BTC is nearing the November lows at $80,000, while ETH slips below $2,800 amid increasing downside pressure.

Shiba Inu Price Forecast: SHIB extends losses as whale selling intensifies bearish momentum

Shiba Inu (SHIB) price slips below $0.0000077 on Thursday after correcting the previous day. Bearish sentiment is further strengthened as holders offload SHIB, increasing selling pressure and reducing Open Interest in the derivatives market.

Top Crypto Losers: Worldcoin, Chiliz, Hyperliquid lead losses as market bleeds $1.75 billion

Worldcoin , Chiliz , and Hyperliquid posted heavy losses over the last 24 hours as Bitcoin dropped below $82,000 on Friday, triggering a $1.75 billion wipeout and mirroring the bearish tremors in the US stock market.

Fidelity unveils FIDD stablecoin, set to launch in coming weeks

Fidelity Investments announced that it will launch its first stablecoin, the Fidelity Digital Dollar (FIDD), making it one of the first large traditional firms in the US to do so.

Bitcoin Price Annual Forecast: BTC holds long-term bullish structure heading into 2026

Bitcoin (BTC) is wrapping up 2025 as one of its most eventful years, defined by unprecedented institutional participation, major regulatory developments, and extreme price volatility.

Bitcoin: BTC correction deepens as Fed stance, US-Iran risks, mining disruptions weigh

Bitcoin (BTC) price extends correction, trading below $82,000 after sliding more than 5% so far this week. The bearish price action in BTC was fueled by fading institutional demand, as evidenced by spot Exchange-Traded Funds (ETFs), which recorded $978 million in inflows through Thursday.