|

Yearn.Finance Price Forecast: YFI’s uptrend is losing steam as on-chain and technicals suggest incoming correction

  • YFI price had a massive 160% pump in the past week but it’s slowing down.
  • Several metrics indicate that YFI is on the verge of a pullback.

After such a massive run, it’s not a surprise to see YFI price finally slow down and consolidate. On-chain and technical indicators suggest the digital asset is on the verge of a major correction as there is very little support on the way down.

YFI price is overextended and faces a pullback

On the daily chart, the TD Sequential indicator is about to present a sell signal which would be the first one since September 2. That last call had a 44% follow-through. A similar drop will drive YFI price towards $10,000.
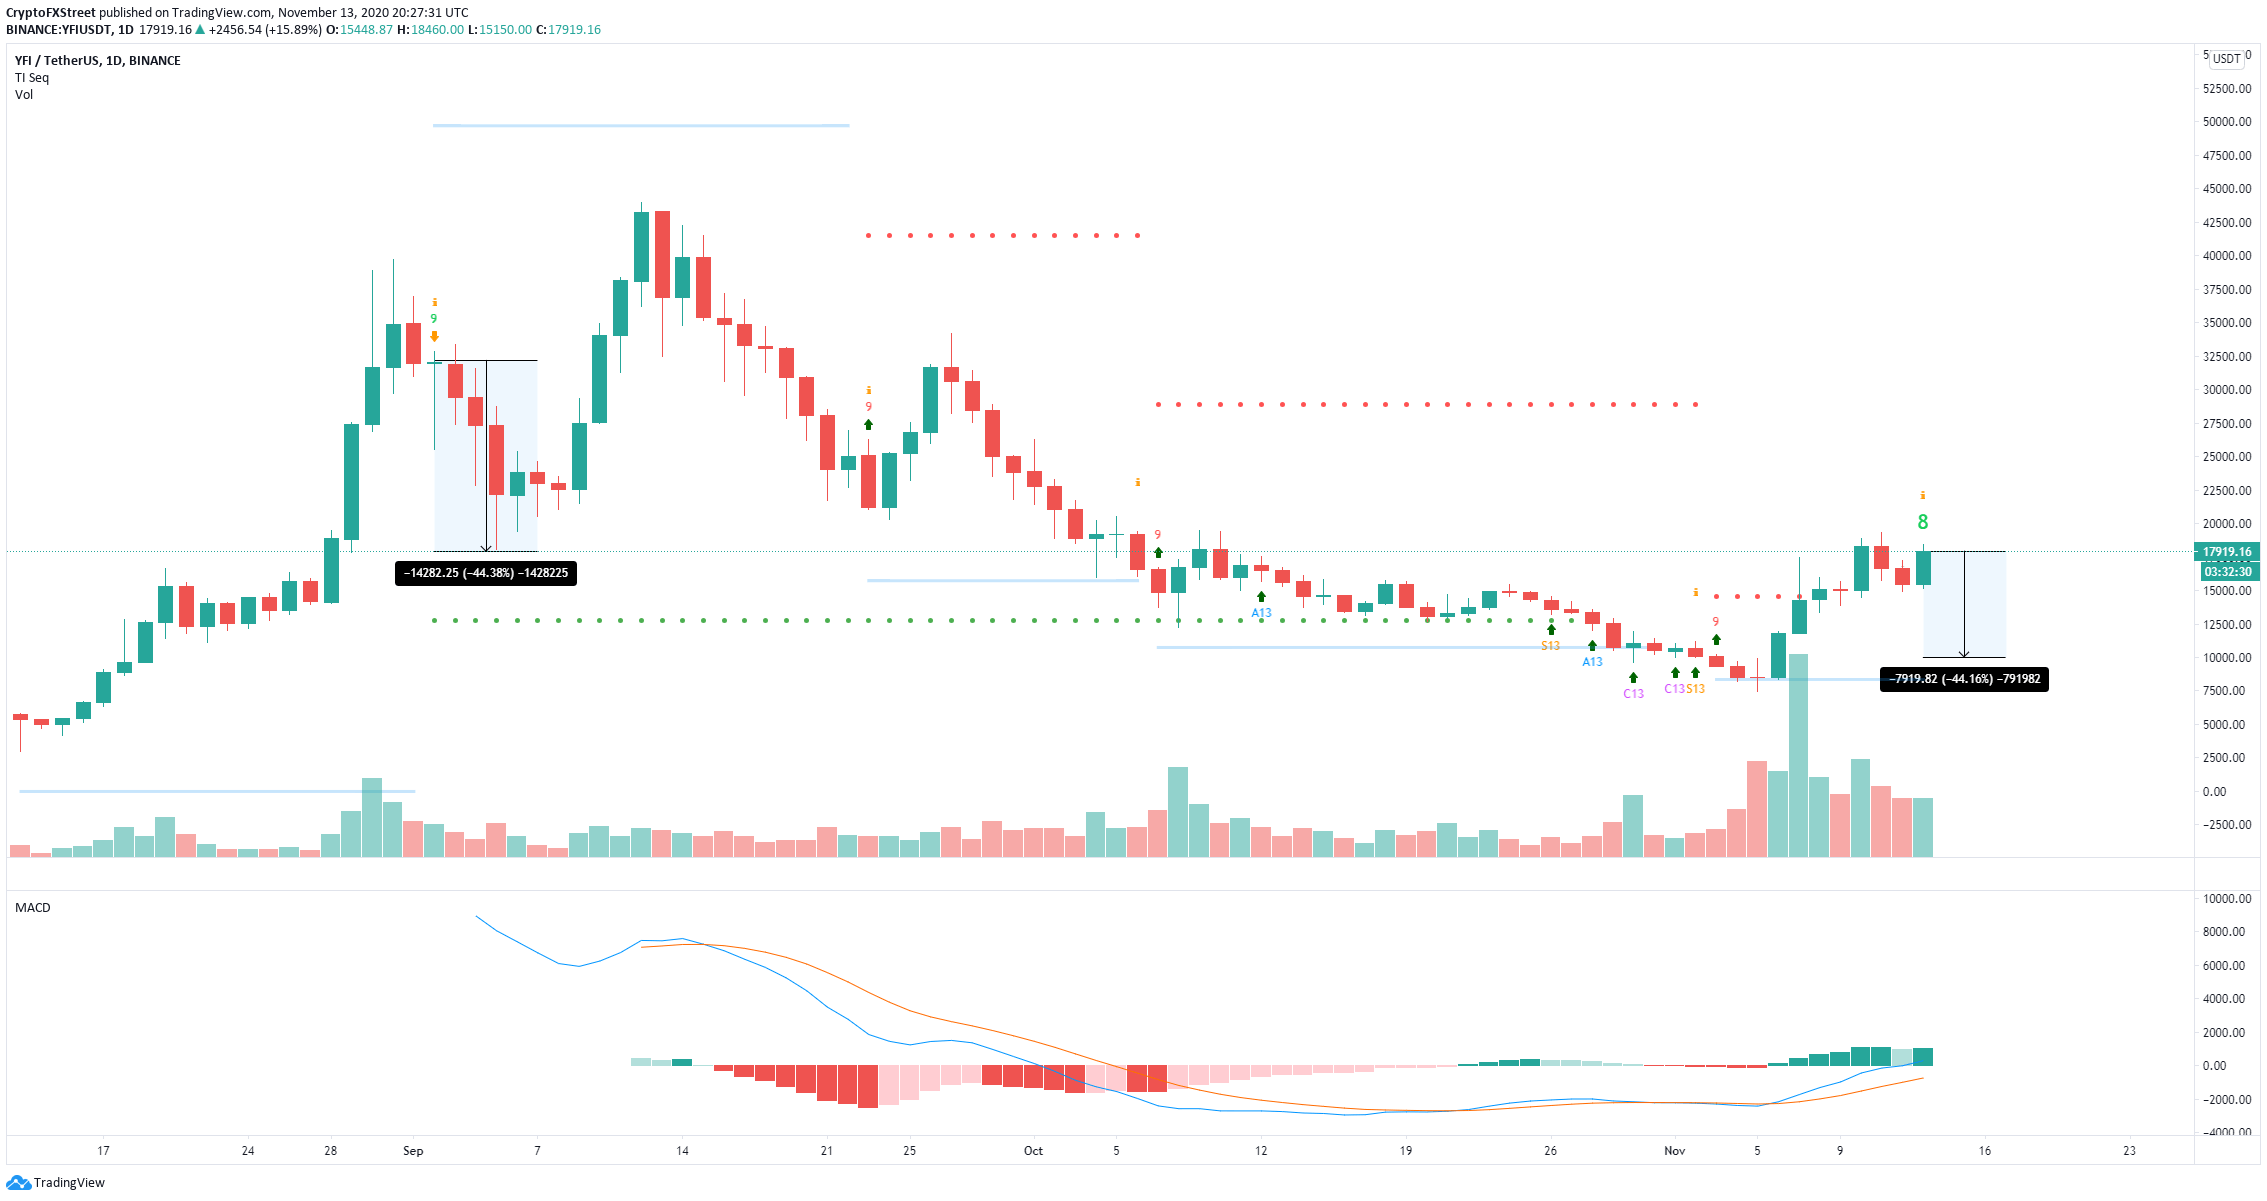
yfi price

YFI/USD daily chart

Despite the spike in the number of new addresses joining the network on November 7, it seems that the trend is a downtrend now. In the past week, this number dropped by 14%. Similarly, the number of active addresses also dropped by 19%, indicating that investors are losing interest in YFI, despite its price growth.

yfi price

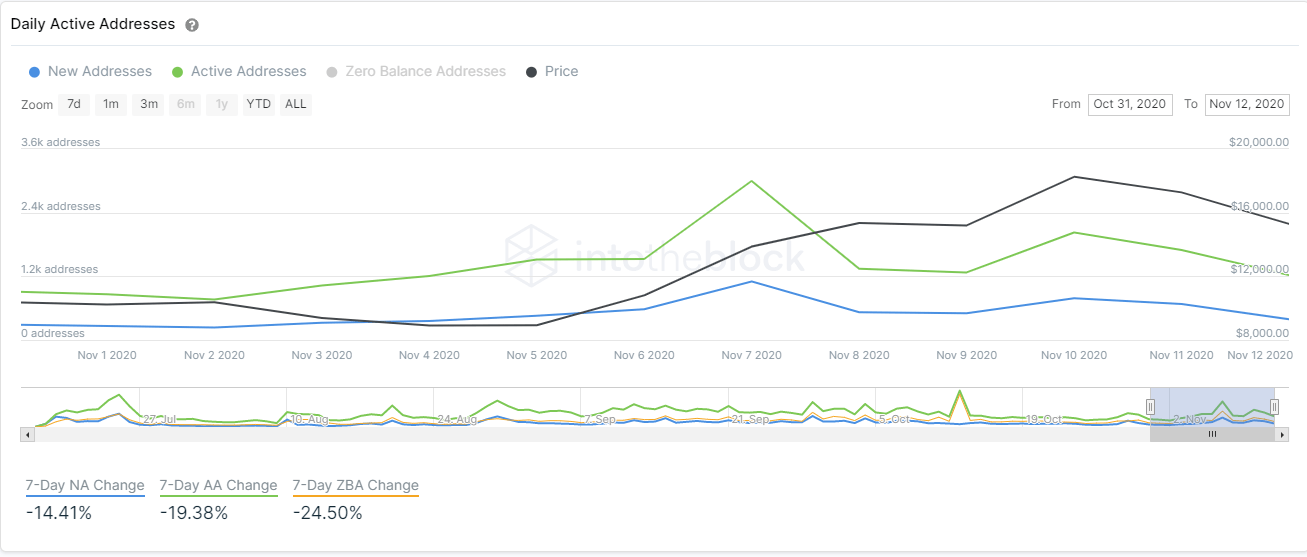
YFI new and active addresses chart

However, if bulls can drive YFI price through the resistance barrier at $18,000, we could see the digital asset jump towards $20,000 in the short-term. The MACD remains quite strong on the daily chart which indicates that bulls might still have some strength left. 

Author

Lorenzo Stroe

Lorenzo Stroe

Independent Analyst

Lorenzo is an experienced Technical Analyst and Content Writer who has been working in the cryptocurrency industry since 2012. He also has a passion for trading.

More from Lorenzo Stroe
Share:

Editor's Picks

Grass 20% bullish breakout defies broader market weakness

Grass (GRASS) is edging up above $0.30 at the time of writing on Monday. The token’s notable 20% intraday surge stands out amid heightened volatility in the broader crypto market.

XRP slides as US-Iran war weakens sentiment

Ripple remains under pressure, trading around $1.35 at the time of writing on Monday. The remittance token extended its down leg to $1.27 on Saturday after the US, in collaboration with Israel, launched attacks on Iran, killing the nation’s Supreme Leader, Ali Khamenei.

Crypto Today: Bitcoin pares losses, Ethereum and XRP drift lower as Middle East conflict pressures risk assets

Bitcoin, Ethereum and Ripple remain on edge as the Israel-US war on Iran risk-off sentiment. The Crypto King trades above $66,000 at the time of writing on Monday, but is struggling to break through the seller congestion around $67,000.

Bitcoin on brink of breakdown amid US-Iran war

Bitcoin (BTC) remains under pressure near the key support level of $65,700. Trading at $66,400 at the time of writing on Monday, a breakdown below this critical level would suggest a deeper correction ahead.

Bitcoin Price Annual Forecast: BTC holds long-term bullish structure heading into 2026

Bitcoin (BTC) is wrapping up 2025 as one of its most eventful years, defined by unprecedented institutional participation, major regulatory developments, and extreme price volatility.

Bitcoin: Another month of losses, and it’s been five

Bitcoin (BTC) price is stabilizing around $68,000 at the time of writing on Friday, but the Crypto King is poised to close February on a fragile footing, marking its fifth consecutive month of losses since October and a rare start to the year with back-to-back monthly corrections.