XRP price to test reliability of support before bulls conquer higher high
- XRP price witnessed a substantial surge on August 11, rallying 30%.
- Following the bullish move, Ripple is expected to consolidate and retest critical support levels before making its next move.
- The cross-border remittance token needs to hold above $0.964 for it to aim for a higher high.

XRP price has nearly doubled its value since its low recorded at $0.514 on July 13. Ripple has made a 30% advance on August 11, leading the bull run across cryptocurrency markets.
XRP price retraces before aiming higher
XRP price has printed an ascending parallel channel on the 12-hour chart, confirming accelerated interest. Ripple has reached the upside target given by the governing technical pattern, surging to $1.088.
Following the 30% rise seen on August 11, XRP price is currently retracing, testing crucial support levels.
The first line of defense for XRP price is at the 38.2% Fibonacci extension level at $0.964. Should selling pressure see an increase, Ripple could retest the upper boundary of the parallel channel as support.
The line of defense could be found at the 200 twelve-hour Simple Moving Average (SMA) at $0.870. If buying pressure subsides further, XRP price could tag the middle boundary of the prevailing chart pattern, coinciding with the 27.2% Fibonacci extension level at $0.832.
The Relative Strength Index (RSI) is indicating that Ripple could be slightly overbought at the moment, leading to its subsequent retracement.
Further losses are not expected at the moment given by this XRP price technical setup. However, should Ripple see a complete reversal of fortune, the cross-border remittance token could fall into the demand zone that extends from the 50 twelve-hour SMA at $0.70 to the lower boundary of the parallel channel at $0.783.
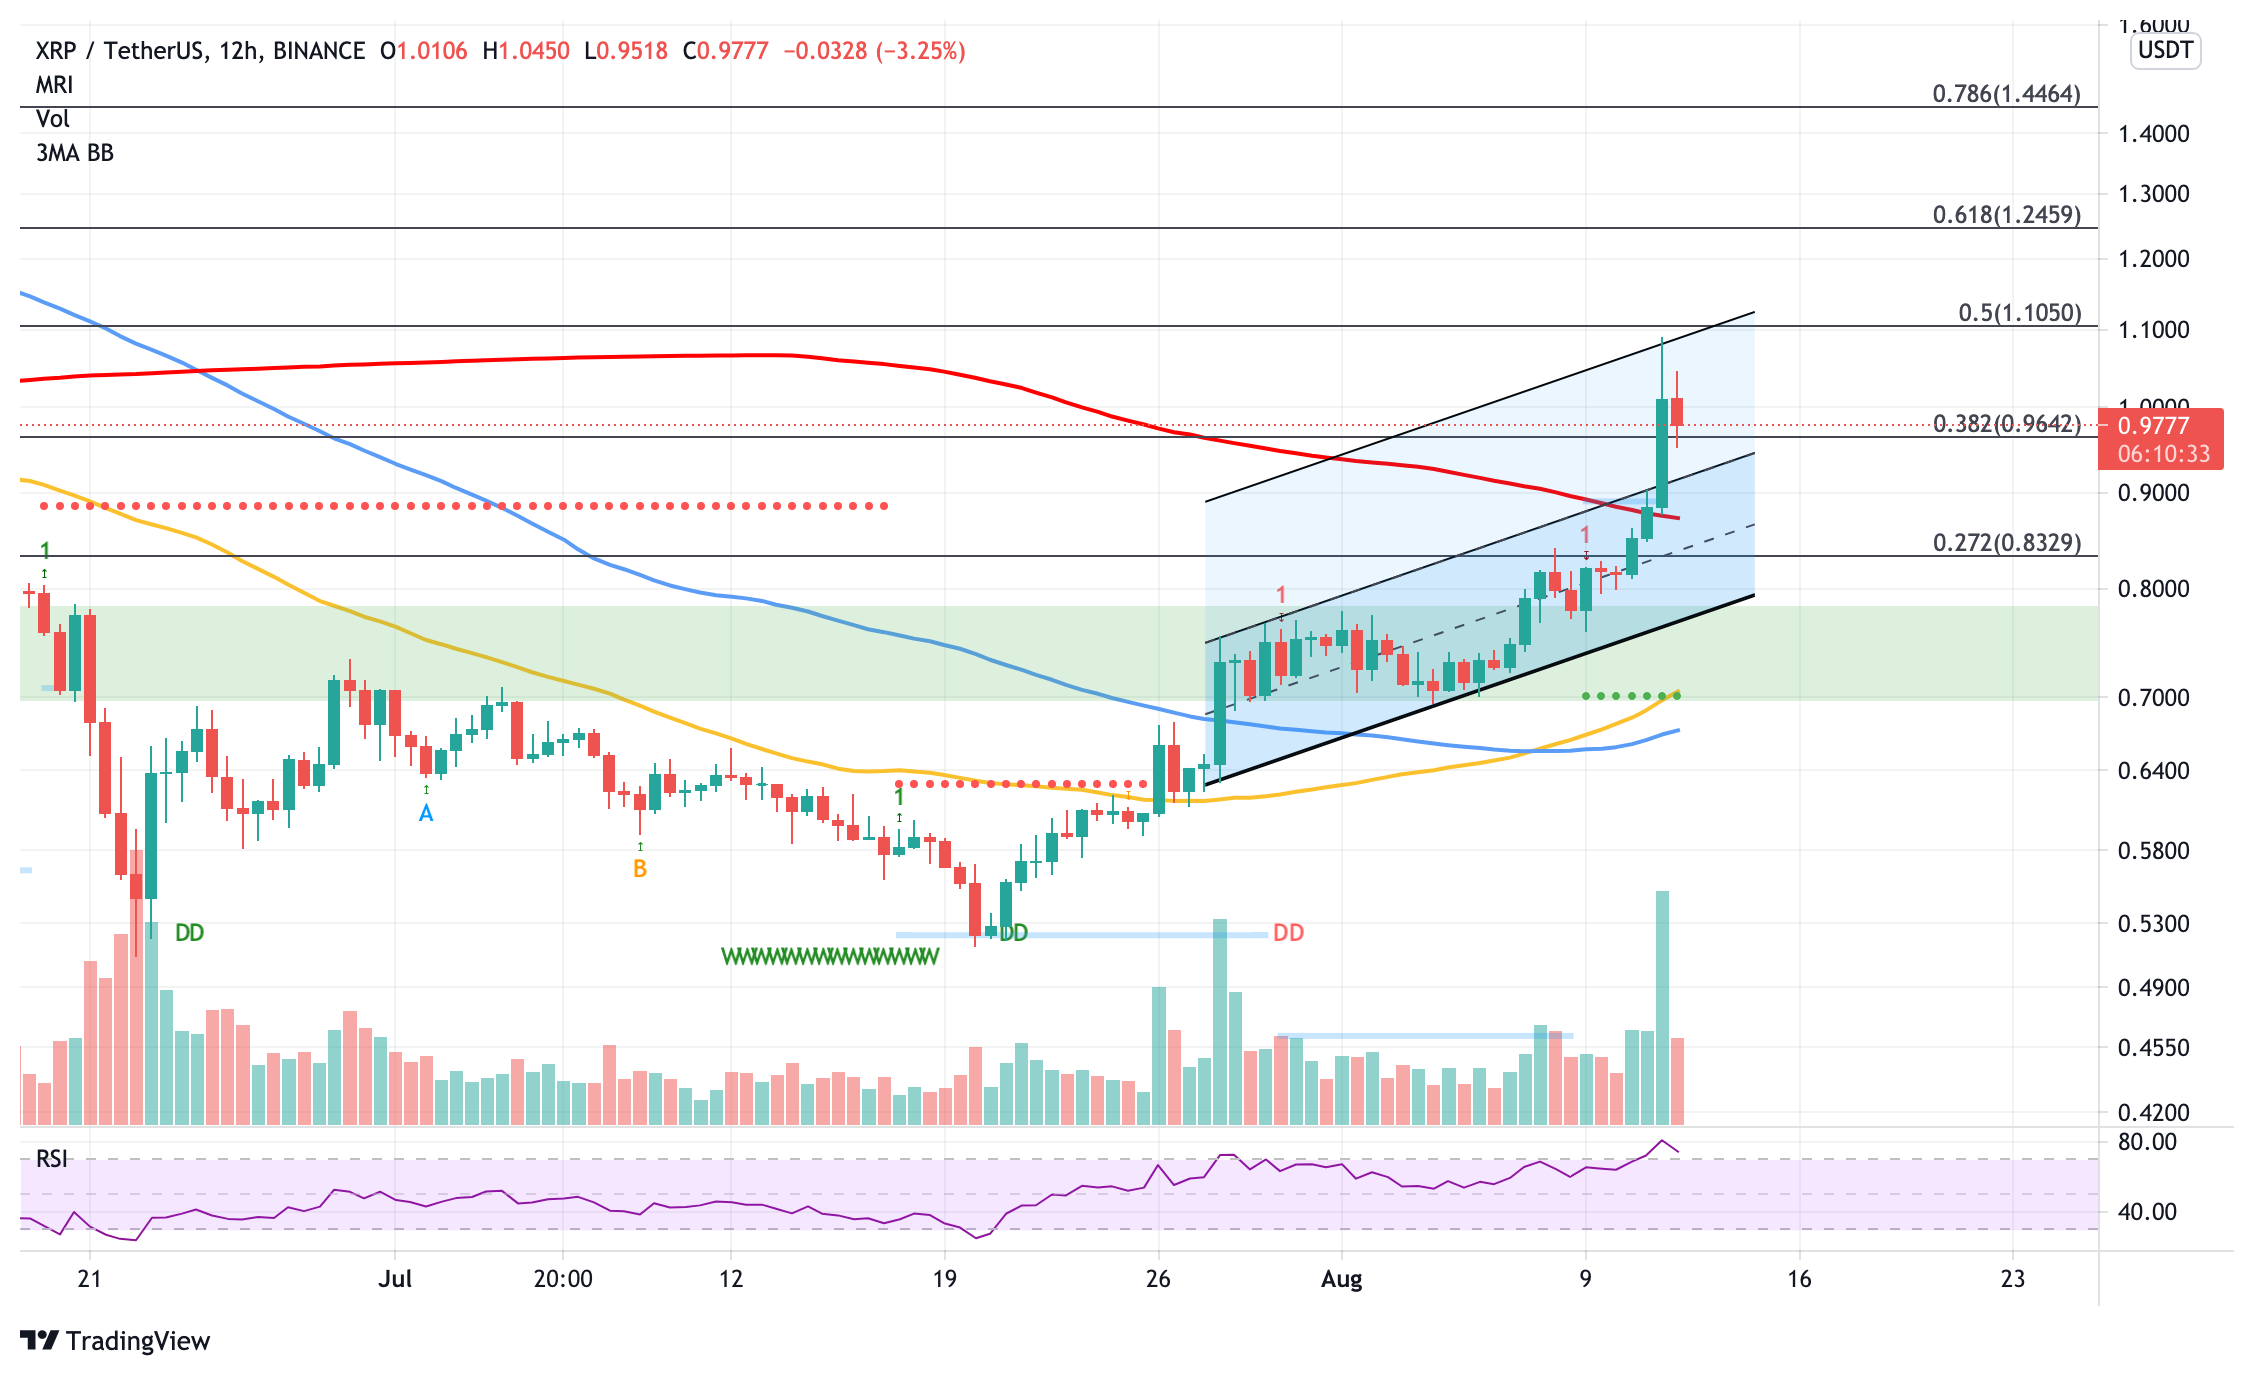
XRP/USDT 12-hour chart
The first resistance for XRP price is at the topside trend line of the governing technical pattern at $1.105, corresponding to the 50% Fibonacci extension level. Bigger aspirations will target the 61.8% Fibonacci extension level at $1.245.
Bullish investors could aim for the 78.6% Fibonacci extension level at $1.446 once the aforementioned resistance levels have been conquered. Ripple should see little resistance ahead as it advances to the upside.
Author

Sarah Tran
Independent Analyst
Sarah has closely followed the growth of blockchain technology and its adoption since 2016.


