Top 3 Price Prediction Bitcoin, Ethereum, Ripple: BTC and altcoins begin to undo gains
- Bitcoin price is contemplating a pullback as the MRI flashes a sell signal.
- Ethereum price might also undergo a minor retracement to complete a massive bullish pattern.
- Ripple price also shows signs of a pullback as the MRI warns of an incoming sell-off.

Bitcoin price witnessed the second leg of its rally that originated on July 20 but failed to produce a convincing close above a crucial support level. Moreover, a technical indicator is flashing a sell signal, further supporting a downswing.
Therefore, investors can expect a minor pullback across the board.
Bitcoin price eyes a potential pullback
Bitcoin price climbed from $29,994 on July 20 to $46,700 as of August 10. This 59% ascent seems to be coming to an end as the Momentum Reversal Indicator (MRI) flashed a red ‘one’ sell signal on the 12-hour chart. This setup forecasts a one-to-four candlestick correction. Therefore, investors need to watch for a minor pullback to the immediate support level at $41,330 or $40,550.
While a retracement is likely, the recently flipped demand zone, extending from $43,150 to $45,321, could hinder the downside movement and produce a consolidation with that area.
Either way, BTC looks bullish and might continue to rally after a brief setback.
In the case of an ascent, the resistance levels at $49,024 and $50,958 will likely be the bulls’ targets.
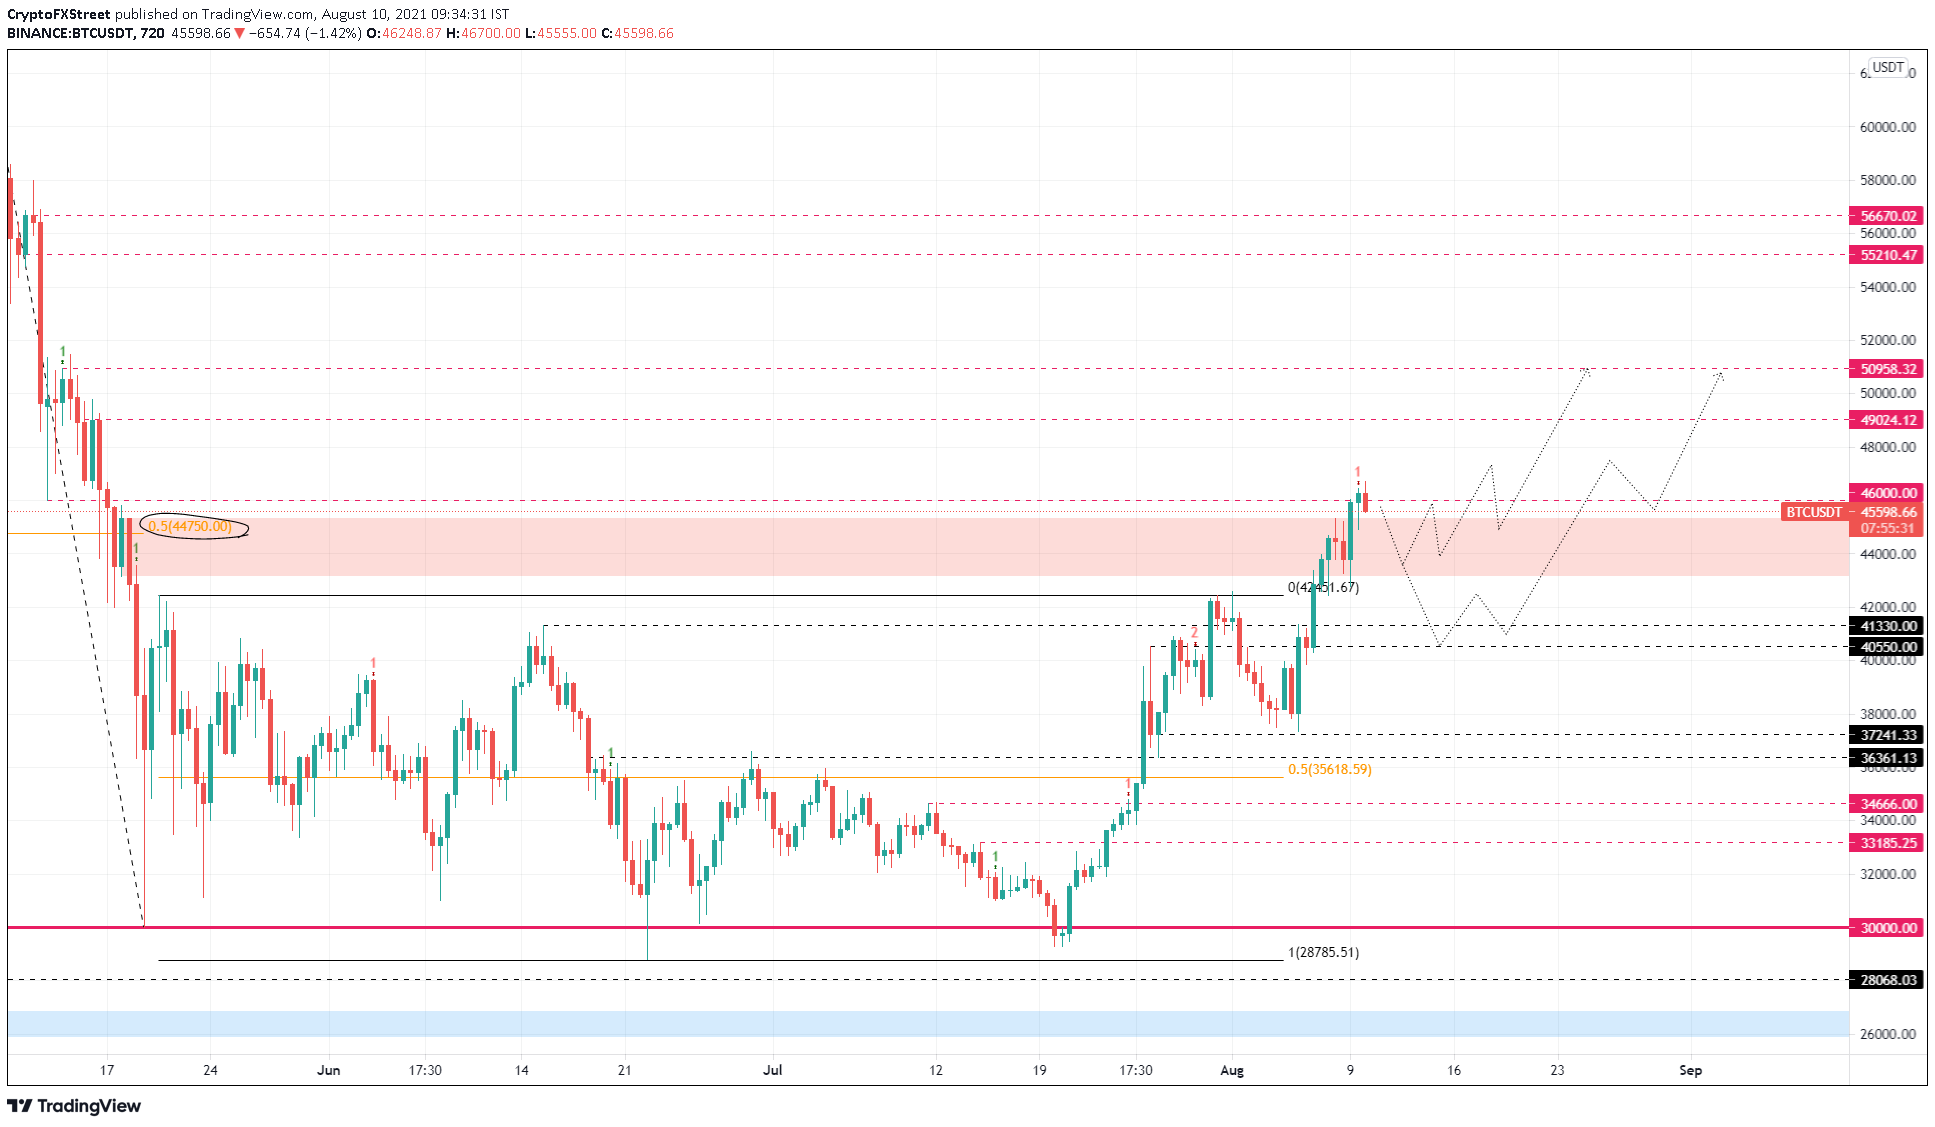
BTC/USDT 12-hour chart
Regardless of the bullish outlook, a potential spike in selling pressure that pushes BTC below $37,241 will negatively impact the upswing and invalidate the bullish thesis since it would produce a lower low.
Ethereum price readies to follow the big crypto
Ethereum price is in more serious trouble than BTC as the Momentum Reversal Indicator (MRI) flashed a red ‘two’ sell signal on the 1-day chart, which indicates an overextended upswing. Since this setup forecasts a one-to-four candlestick correction, investors can expect the downtrend to head much lower.
The immediate support level at $2,640 is the most likely area for a reversal, but in some cases ETH might retest $2,345, the trading range’s midpoint.
The reversal that stems from the area mentioned above will likely shatter $3,240 and $3,371 and make a run at the $3,716 resistance barrier.
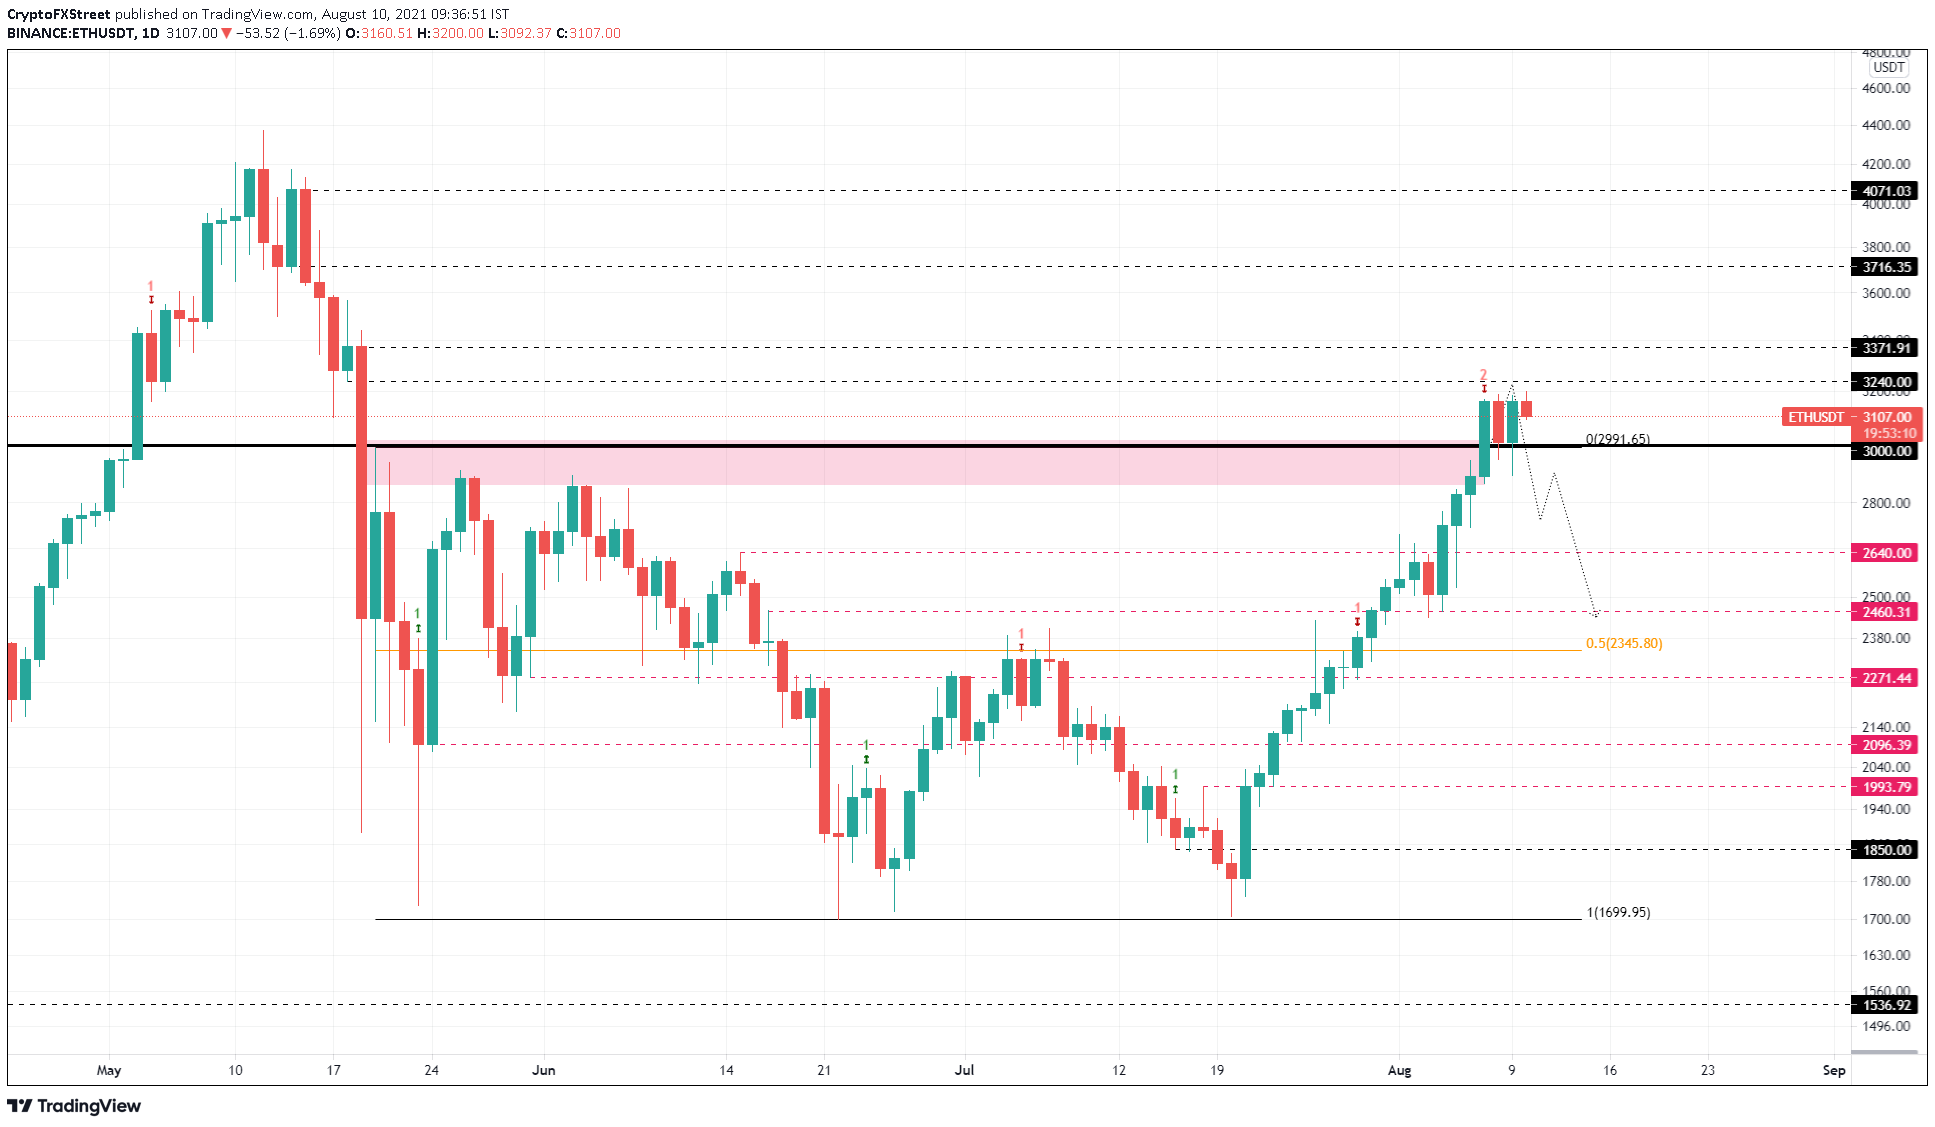
ETH/USDT 1-day chart
Perhaps the most logical reason for the failure of the bullish thesis is due to Ethereum’s correlation with Bitcoin. If BTC flash crashes, ETH will follow suit.
Therefore, a decisive daily close below $2,271 will invalidate the optimistic scenario and open up the path for further descent.
Ripple price awaits a trigger
Ripple price is also plagued by the MRI that flashed a red ‘one’ sell signal on the 12-hour chart. Therefore, investors can expect a one-to-four candlestick correction.
Moreover, this warning sign arrives after XRP price failed twice to slice through the $0.827 resistance barrier. The resulting downswing might reverse around $0.777 or head to $0.689 if the selling pressure increases.
A retest of $0.689 will produce a double bottom, and if the buyers make a comeback around this area, XRP price will likely restart its upswing. If the resulting climb flips $0.827 into a support level, market participants can expect this remittance token to hit $0.91 and $1 in a highly bullish case.
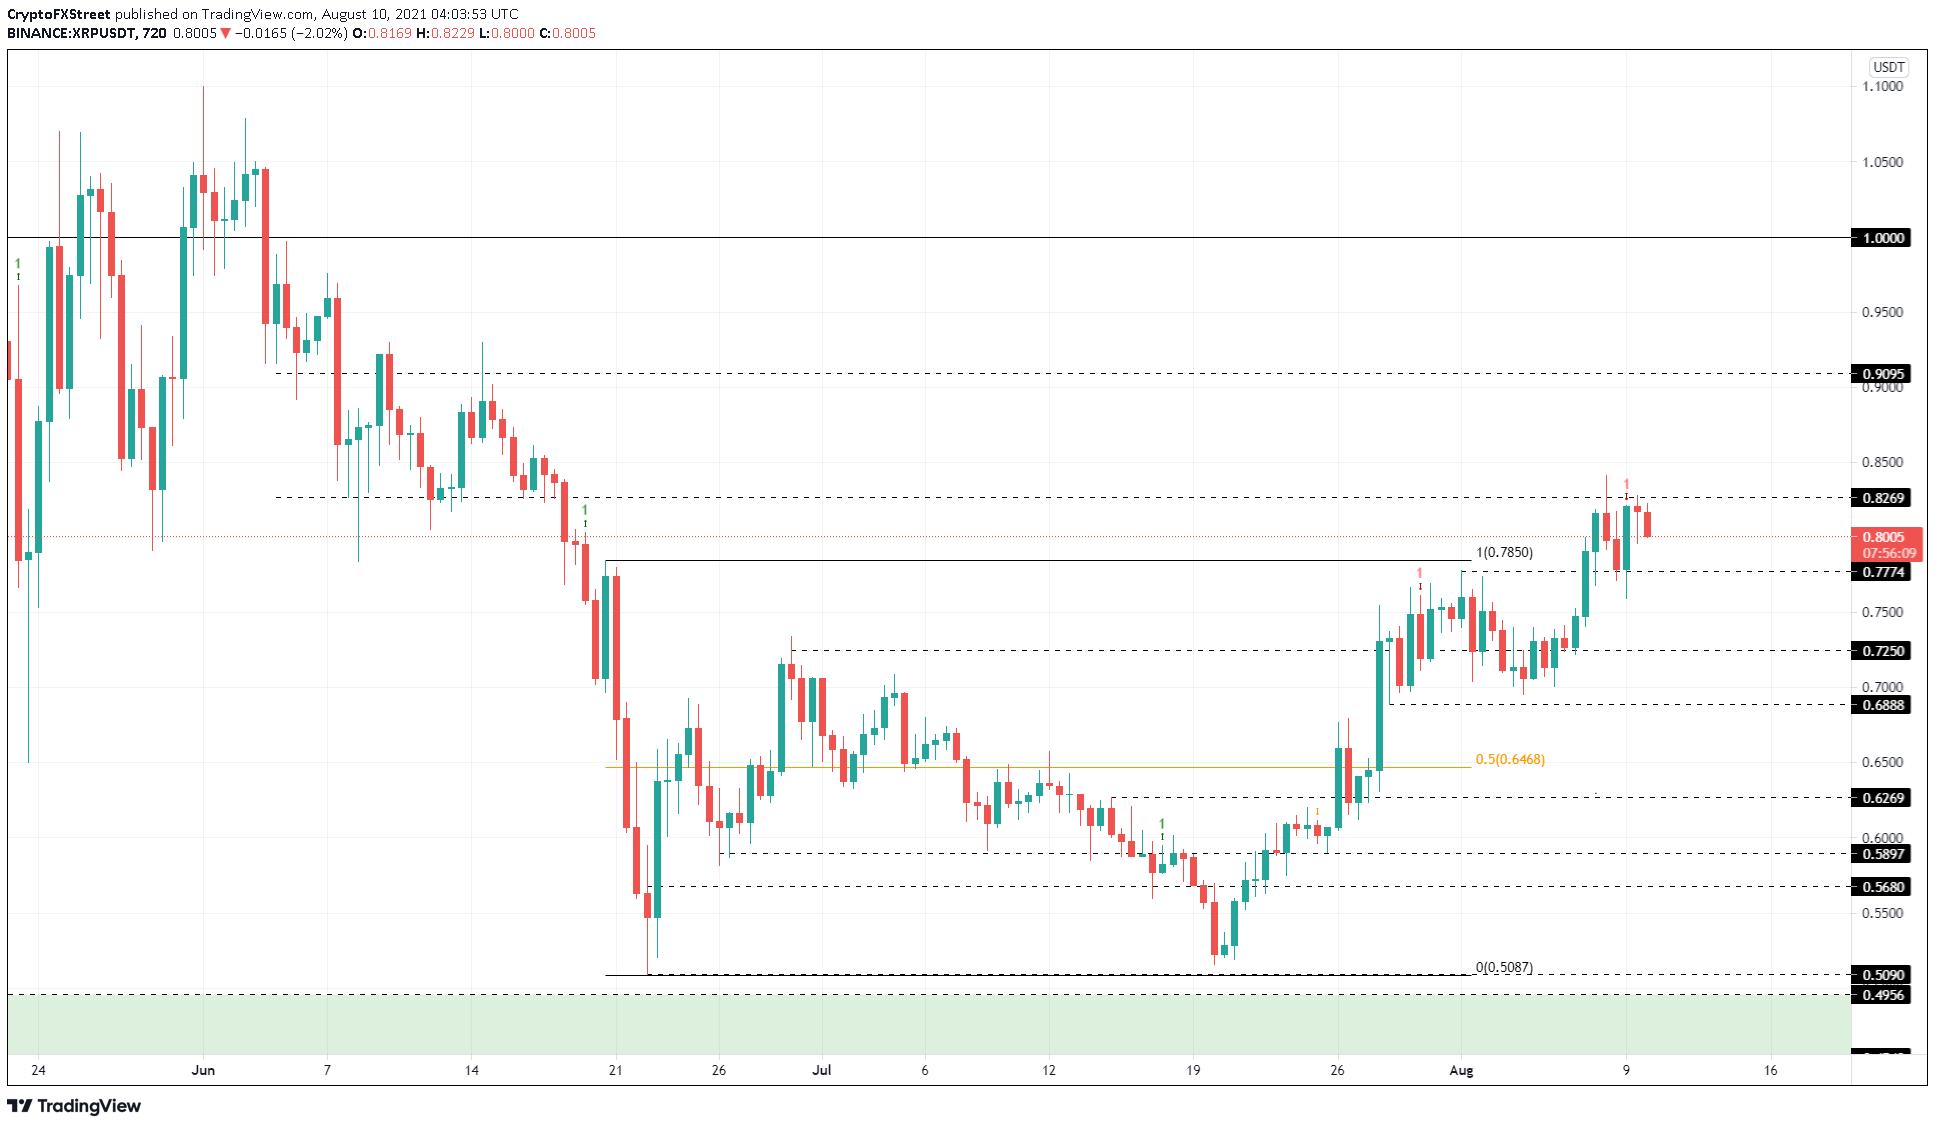
XRP/USDT 12-hour chart
While things seem to be relatively better for XRP price, a breakdown of the $0.725 support level might jeopardize the bullish outlook as it would create a lower low.
However, a breach of the $0.689 would seal the deal and invalidate the optimistic scenario.
Author

Akash Girimath
FXStreet
Akash Girimath is a Mechanical Engineer interested in the chaos of the financial markets. Trying to make sense of this convoluted yet fascinating space, he switched his engineering job to become a crypto reporter and analyst.


