Top 3 Price Prediction Bitcoin, Ethereum, Ripple: BTC exudes confidence as ETH and XRP test newly discovered support
- Bitcoin price closed the week up 9.94% for the third consecutive positive week.
- Ethereum price closed the week up 17.95%, marking the best week since the beginning of May.
- XRP price closed the week up 7.52% for the third consecutive positive week and the first time since early April.

Bitcoin price shrugs off resistance, while ETH and XRP are retesting the breakouts. The overall impulsiveness of the rally has not diminished as the three cryptocurrencies are overcoming widespread doubt and concerns.
Bitcoin price quickly discards resistance
Bitcoin price is up 54% since July 21, marking the third-best gain 20-day gain in 2021 and lifting BTC 285% over the last 52-weeks. The impulsive action began with a bullish outside week on the bar charts at the 50-week simple moving average (SMA).
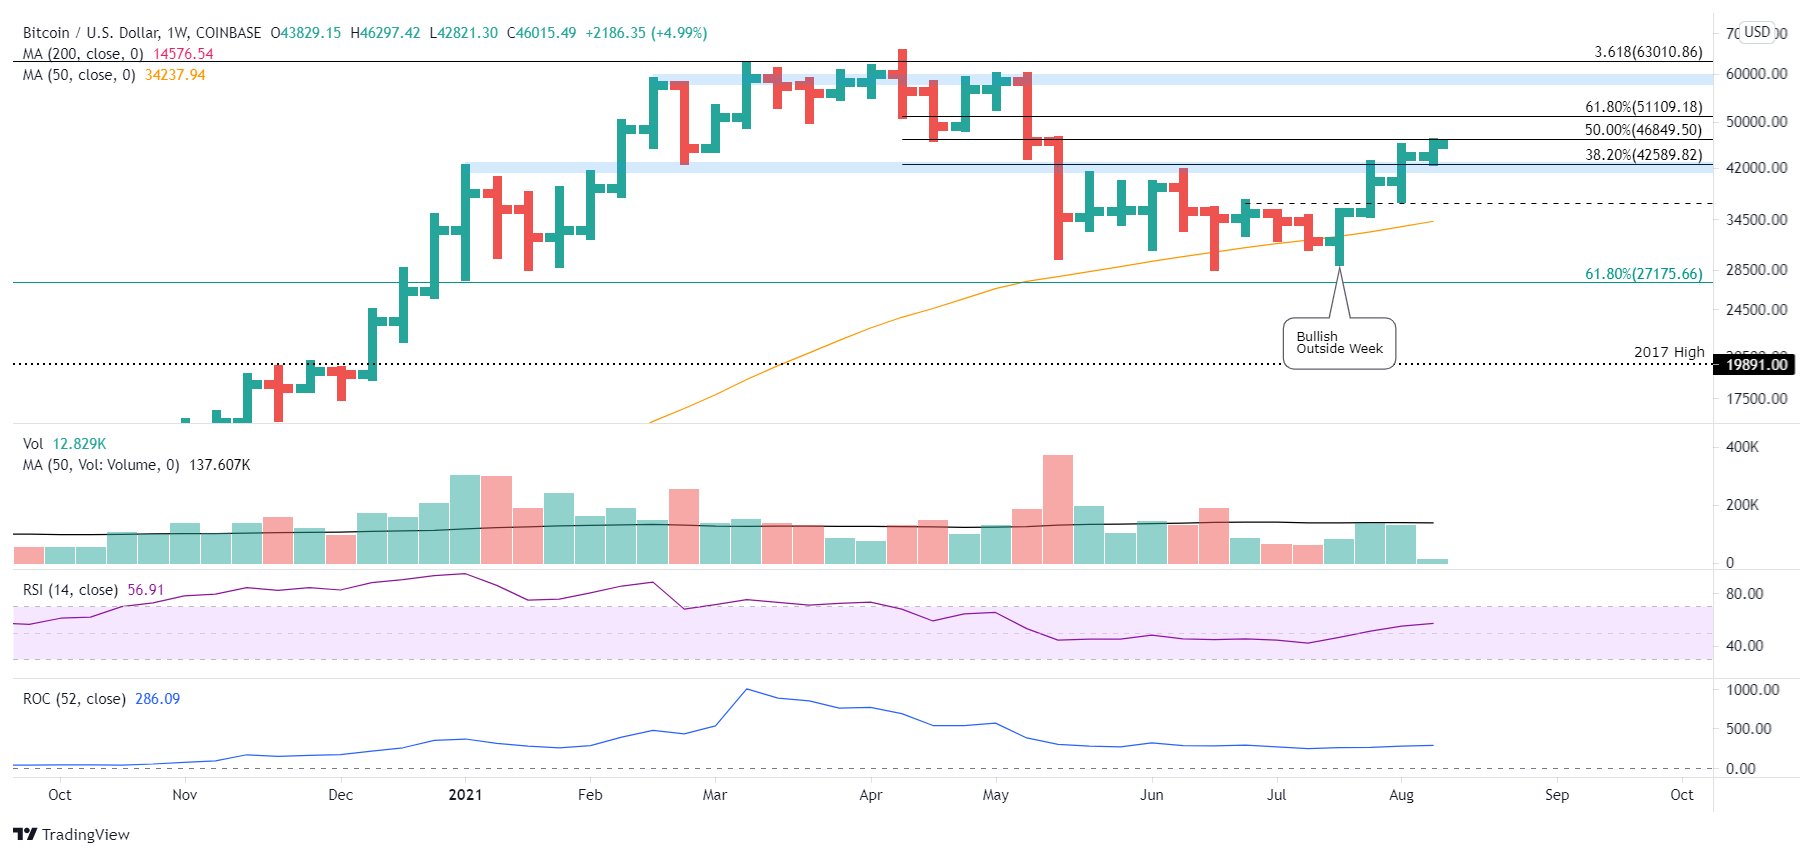
BTC/USD weekly chart
Bitcoin price cleared the trifecta of resistance of the January high of $41,322, the 38.2% retracement at $42,589 and the February 28 low of $43,016 with relative ease, establishing the range as crucial support for BTC moving forward.
Bitcoin price is now trying to clear the strategically important 200-day SMA at $44,983 with a bullish outside day on the bar charts. Beyond the 200-day SMA, Bitcoin price is primed to overcome the BTC resistance associated with the 50% and 61.8% retracement levels at $46,849 and $51,109, respectively, before discovering the next genuine resistance around $57,750.
Critical to the bullish narrative is the support granted by the previous trifecta of resistance between $41,322 and $43,016. A failure to hold leaves Bitcoin price vulnerable to a test of the June 29 high of $36,675 and potentially the 50-day SMA at $35,589.
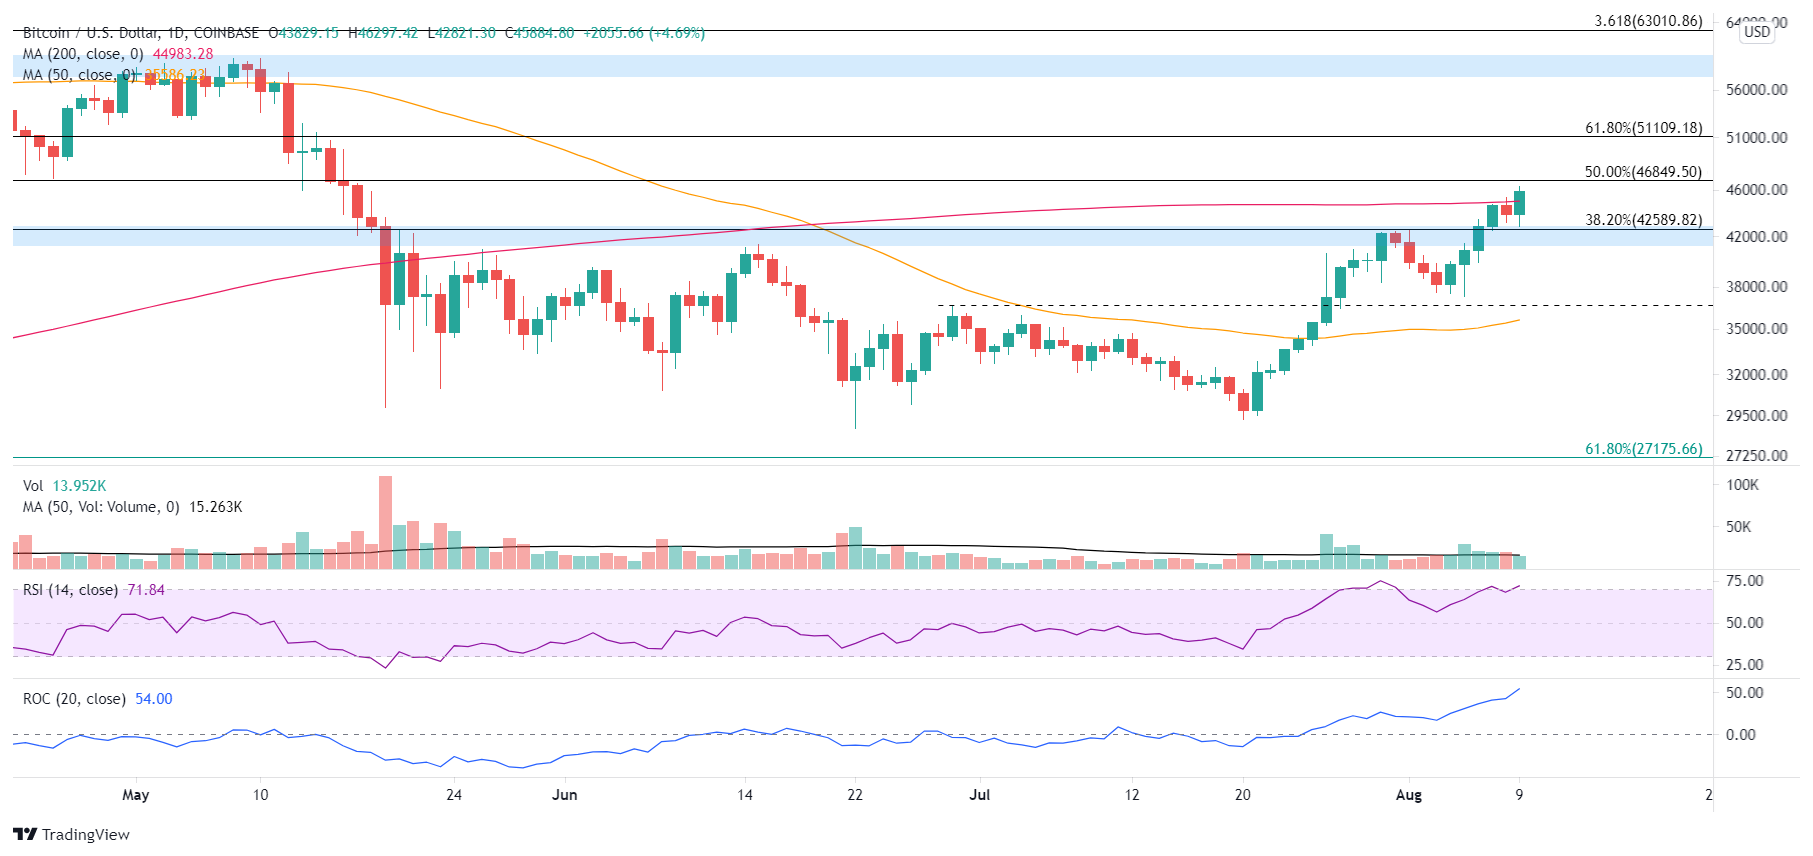
BTC/USD daily chart
If Bitcoin price does pursue a correction now, ideally, the correction is in time versus price, keeping the momentum elevated and clearing the weak holders that want to lock in profits or use the rally to break even on previously held losing positions.
Supporting a Bitcoin price correction is the Santiment Weighted Social Sentiment metric on a 30 twelve-hour smoothed basis. The moving average is now at the same level that preceded the correction in February and matched the March correction.
The Weighted Social Sentiment labels all daily coin mentions collected by Santiment as either positive, negative or ambivalent, in an attempt to visualize the average mood of the crypto community towards BTC.
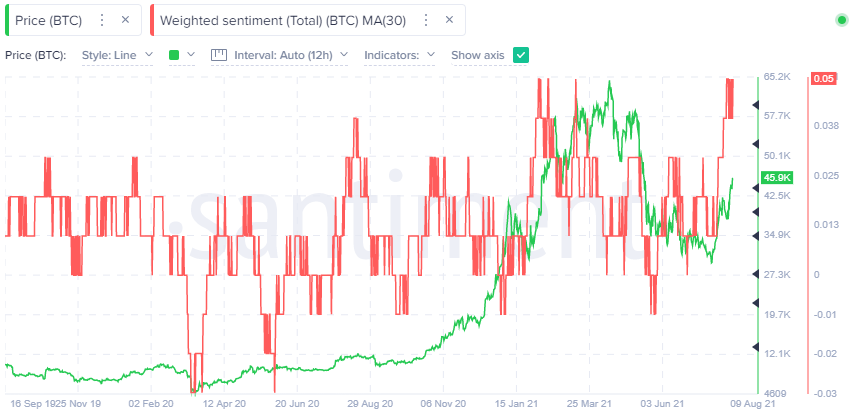
BTC Weighted Social Sentiment - Santiment
A second metric that also hints at the possibility of Bitcoin price correction is the BTC 30-day MVRV ratio. This on-chain metric attempts to quantify the average profit or loss of all addresses that have acquired BTC within a 30-day time frame.
Currently, the BTC 30-day MVRV ratio is +20.29%, suggesting that the average gain of all addresses that have acquired BTC in the last 30 days is 20.29%. The higher the ratio, the greater the uncaptured gain, thus creating a higher risk that BTC speculators will reduce their exposure.
The 20.29% reading is not at the same level as in January before the correction or before the February correction. Still, it is near the level corresponding to the November-December consolidation.
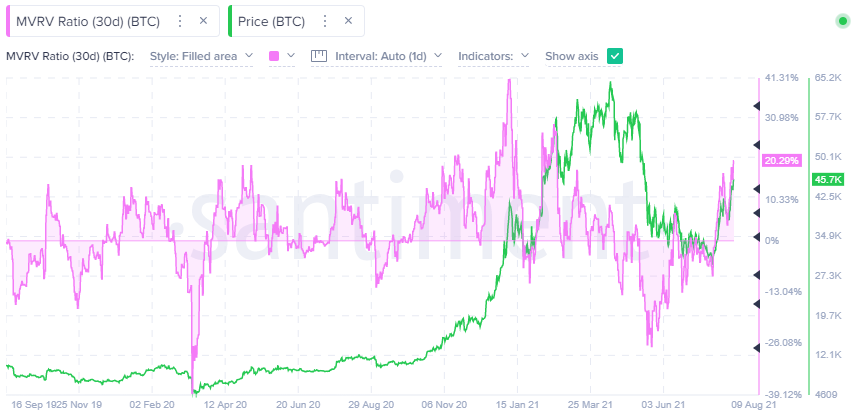
BTC 30-day MVRV Ratio - Santiment
Here, FXStreet's analysts evaluate where BTC could be heading next as it reaches a vital resistance level.
Ethereum price greets London Fork with applause
Ethereum price has recorded only two negative days since July 21 and achieved a 76.50% gain over that period based on the current price. ETH is up 626.94% over the last 52 weeks.
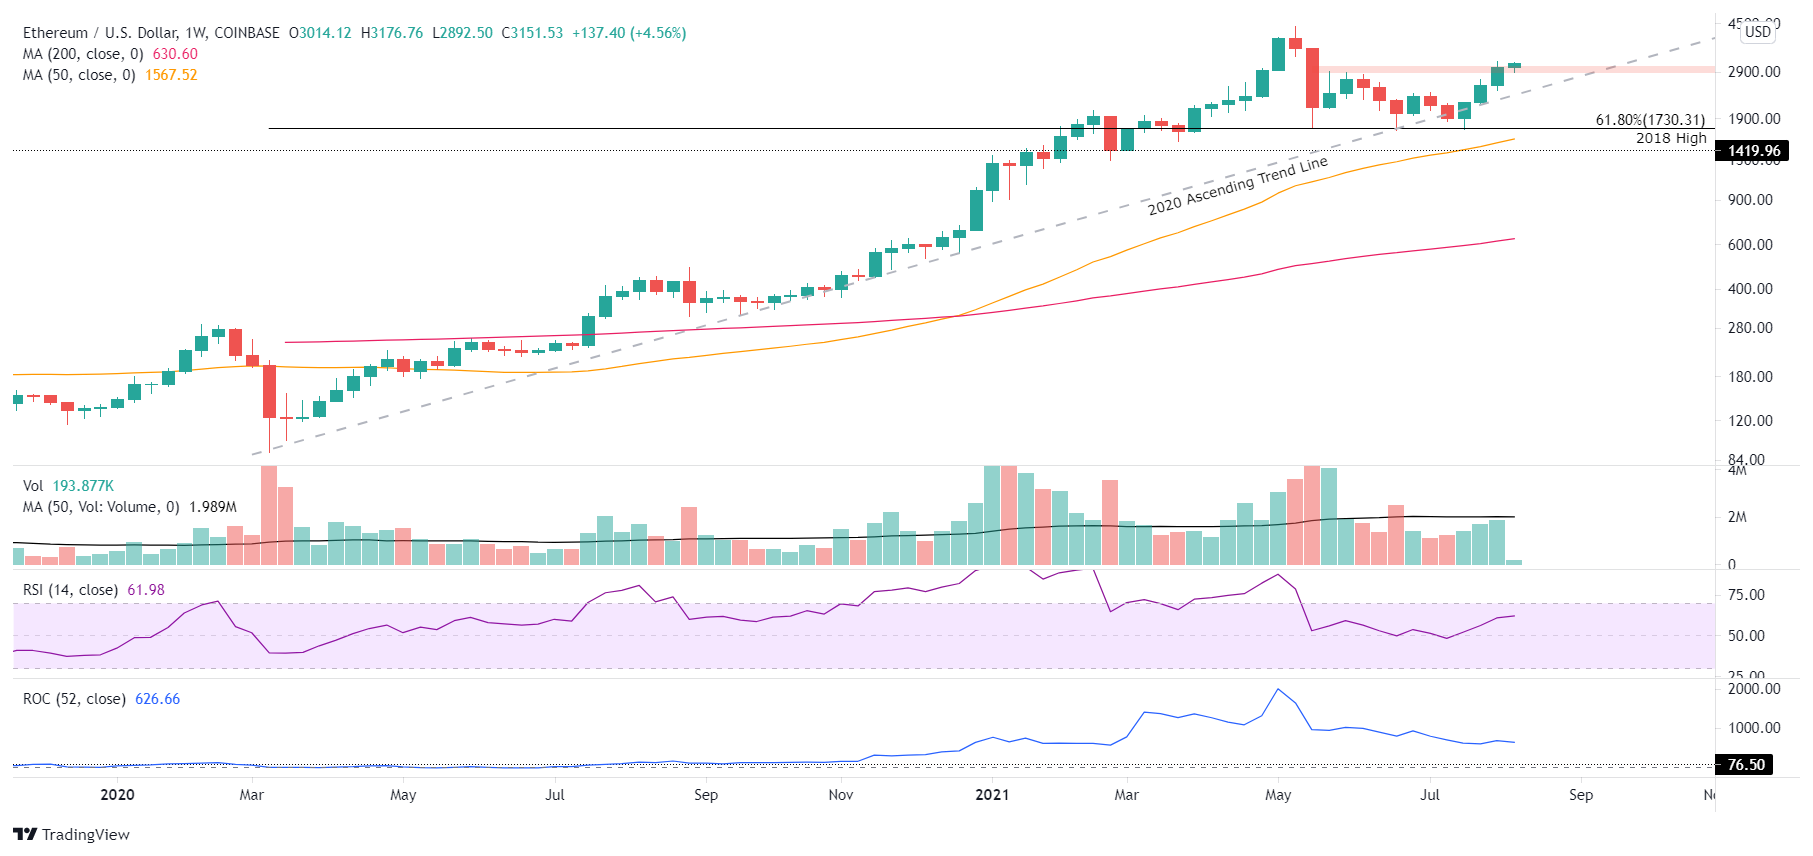
ETH/USD weekly chart
On August 7, Ethereum price closed above the price congestion framed by the June 3 high of $2,890, the May 26 high of $2,913 and the May 20 high of $3,000, creating a new support line for ETH.
If Ethereum price successfully holds the newly discovered support during any consolidation, it will be free to test the all-time high in the coming weeks, despite the overbought condition on the daily Relative Strength Index.
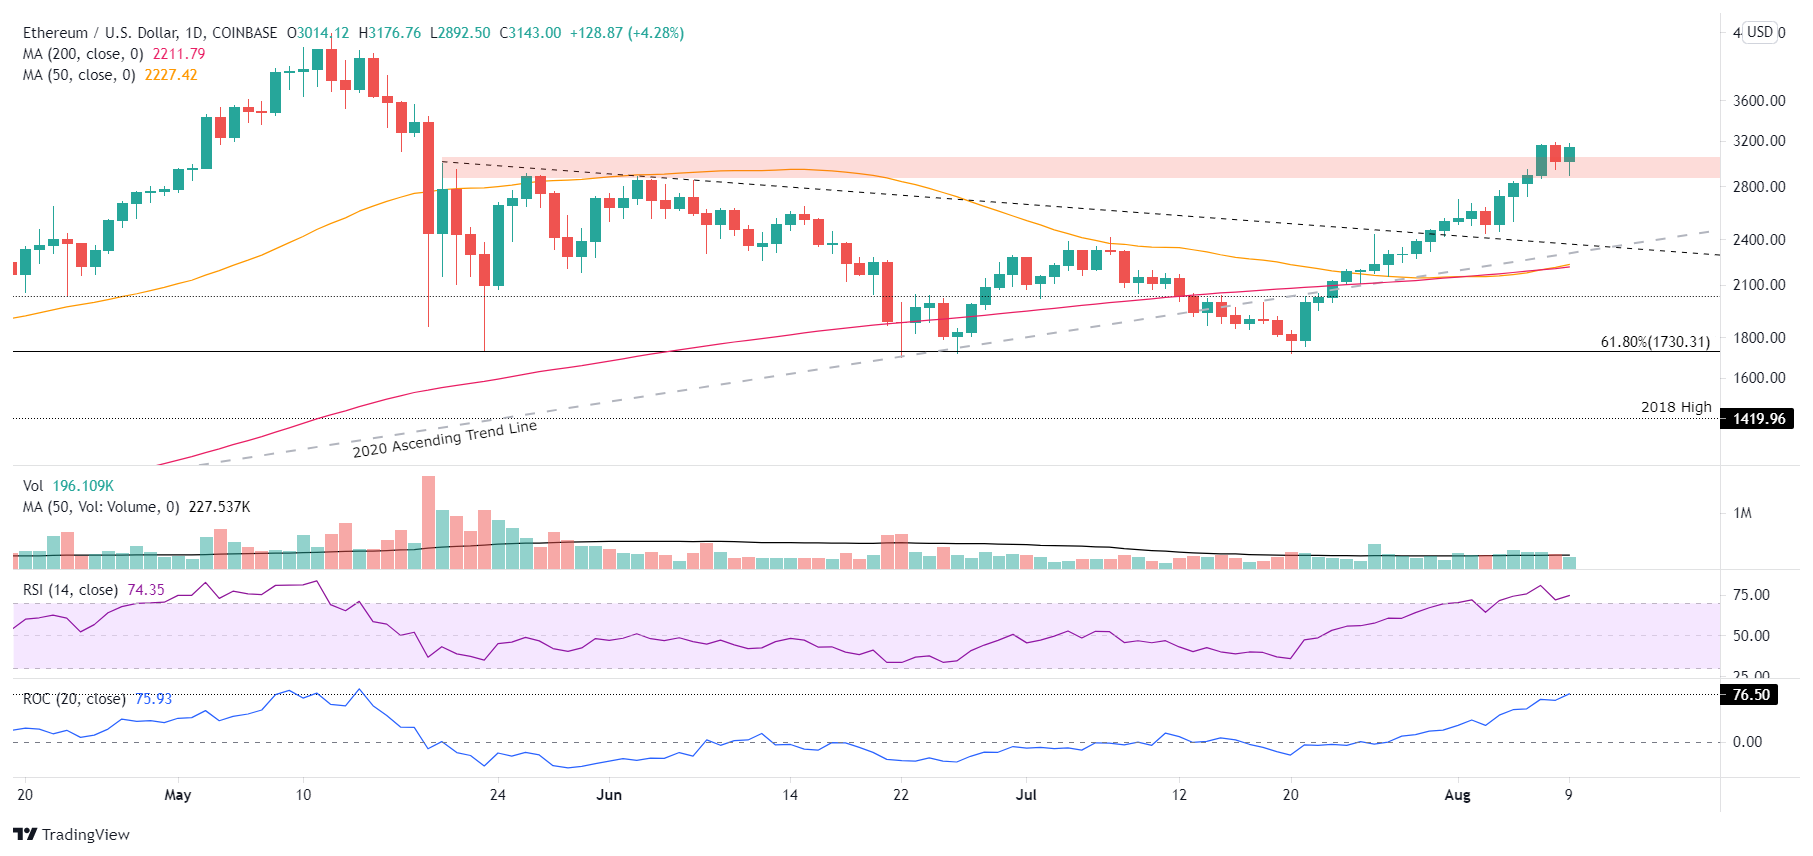
ETH/USD daily chart
Alternatively, suppose Ethereum price does not hold the support. In that case, ETH may fall to the July 7 high of $2,411 and even down to the 2020 ascending trend line at $2,300 if the broader cryptocurrency market undergoes a bout of selling pressure.
Here, FXStreet's analysts evaluate where ETH could be heading next after reaching the target.
XRP price readies for a new bull market
XRP price has rallied 54.35% since July 21 and is currently up 167.70% over the last 52 weeks after three consecutive positive weeks for the first time since the beginning of April.
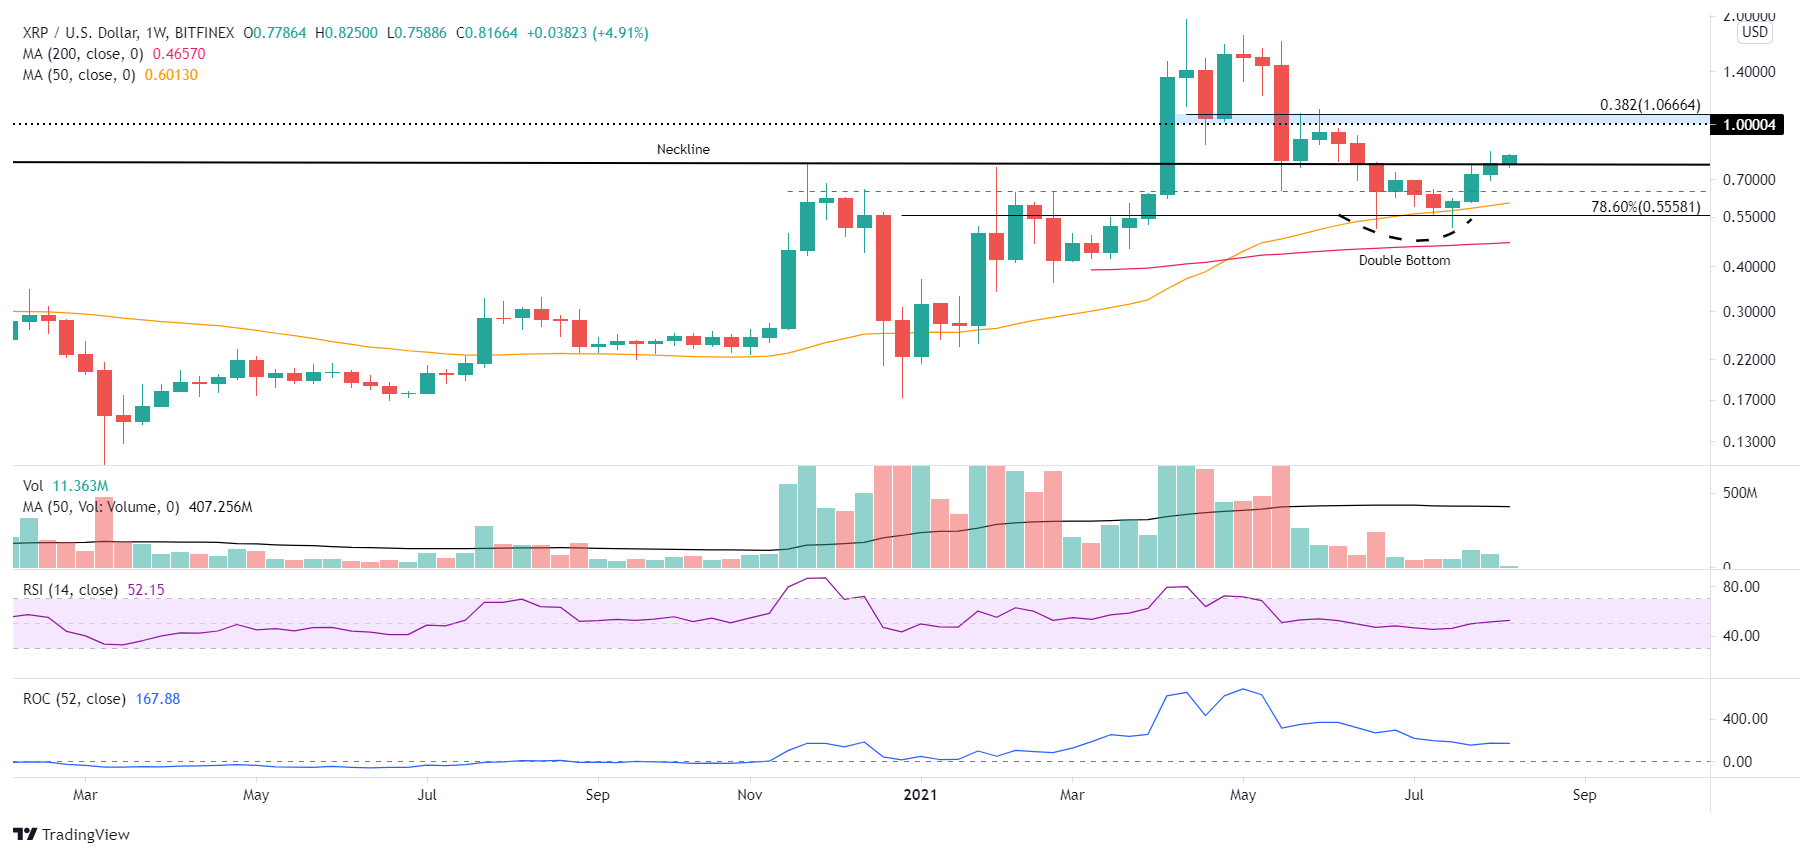
XRP/USD weekly chart
XRP price cleared the neckline and the 200-day SMA at $0.791 on August 7 after a multi-day consolidation in time, rather than price, while trading tight to the double bottom trigger of $0.733. Ripple is now testing the new support with success.
The double bottom’s measured move is just over 30%, defining a profit target of $0.953 based on the pattern trigger price of $0.733. The XRP price target does fall short of the significance outlined by the psychologically important $1.00 and the 38.2% retracement level of the April-June correction at $1.06. A rally to $1.06 would reward Ripple investors that bought the August 7 close with a 30.69% gain.
The only obstacle XRP price confronts in the path to the measured move price target, or $1.06, is the magnet effect of the 200-day SMA at $0.796 with the neckline of the Ripple multi-year inverse head-and-shoulders pattern around $0.772.
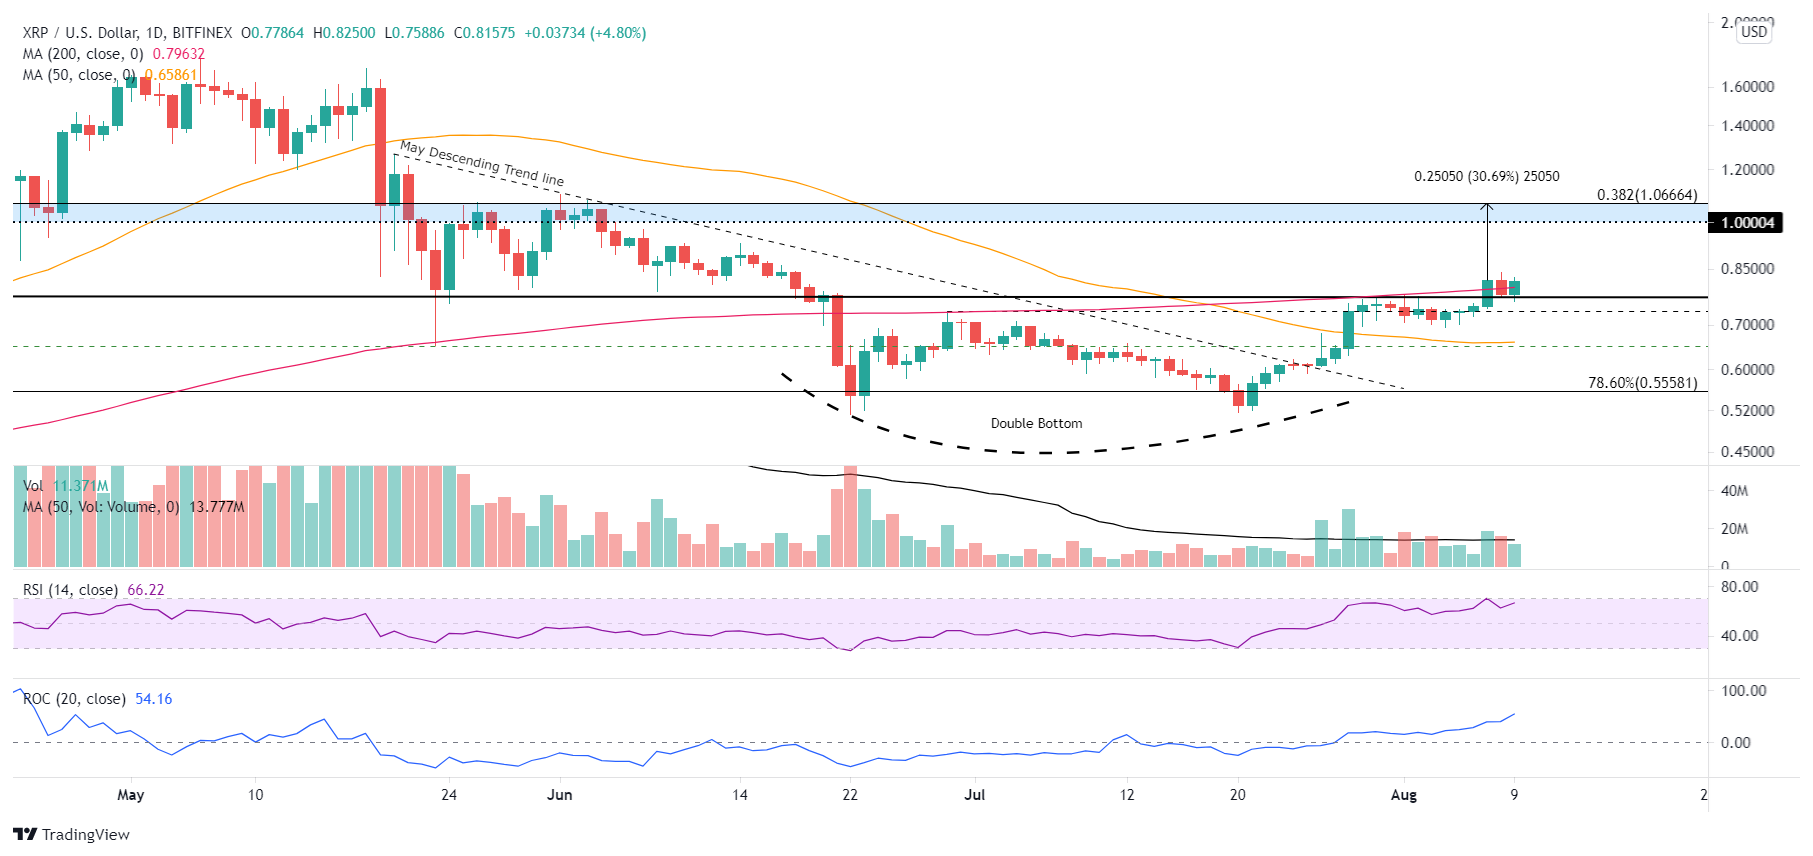
XRP/USD daily chart
A failure of Ripple to hold the 200-day SMA at $0.796, the neckline at $0.772 and the double bottom trigger at $0.733 positions XRP price to test the bottoming 50-day SMA at $0.658 or the May 23 low of $0.652.
All three cryptocurrencies have displayed the type of impulsiveness or confidence that forms sustainable lows and rallies. However, Bitcoin price is getting overvalued based on the 30-day MVRV ratio, and the rally has lifted social media positive mentions to readings that coincided with previous corrections. Simultaneously, Ethereum price is balancing an extended rally with continued bullish interest in the London Fork and XRP price is aggressively testing the newfound support of the 200-day SMA and the neckline.
Here, FXStreet's analysts evaluate where Ripple could be heading next as it looks ready to advance further.
Author

Sheldon McIntyre, CMT
Independent Analyst
Sheldon has 24 years of investment experience holding various positions in companies based in the United States and Chile. His core competencies include BRIC and G-10 equity markets, swing and position trading and technical analysis.


