XRP price risk builds to the downside, $0.65 in the crosshairs
- XRP price dropped below the neckline of a head-and-shoulders pattern on May 27.
- 50 four-hour simple moving average (SMA) remains a technical obstacle for emerging intra-day bounces.
- ‘Legal uncertainty price range’ in the crosshairs as selling accelerates below $1.00.

XRP price closed May 23 with a bullish hammer candlestick pattern on the 12-hour chart that was triggered on May 24 when Ripple surged above $0.816. The candlestick was formed in the ‘legal uncertainty range’ associated with the November 2020 high and the December 2020 low when the SEC case was announced. The Ripple bounce has been short-lived, and the digital asset is on pace for a new correction low.
XRP price razed by broad crypto market selling
From May 24 to May 27, XRP price oscillated along the psychologically important $1.00 but could not overcome the declining 50 four-hour SMA. The Ripple price action during this time was passive with little volume, showing no real investor commitment. The result was a clear head-and-shoulders top.
On May 28, on a surge in volume, Ripple broke below the neckline at $0.968 and quickly fell to $0.846 before staging a minor rebound into the stubborn 50 four-hour SMA. XRP price has since dropped below the head-and-shoulders measured move target of $0.818.
The failure to hold the measured move target of $0.818 raises the possibility that XRP price will test the upper level of the ‘legal uncertainty price range’ at $0.780 and may even test the February 21 high at $0.757, representing a 20% decline from the neckline. Any further weakness leaves Ripple vulnerable to a plunge below the May 23 low at $0.652 and may even force the cross-border remittances token to engage the 78.6% Fibonacci retracement from the December 29 low at $0.555, yielding a 30% from the price at the time of writing.
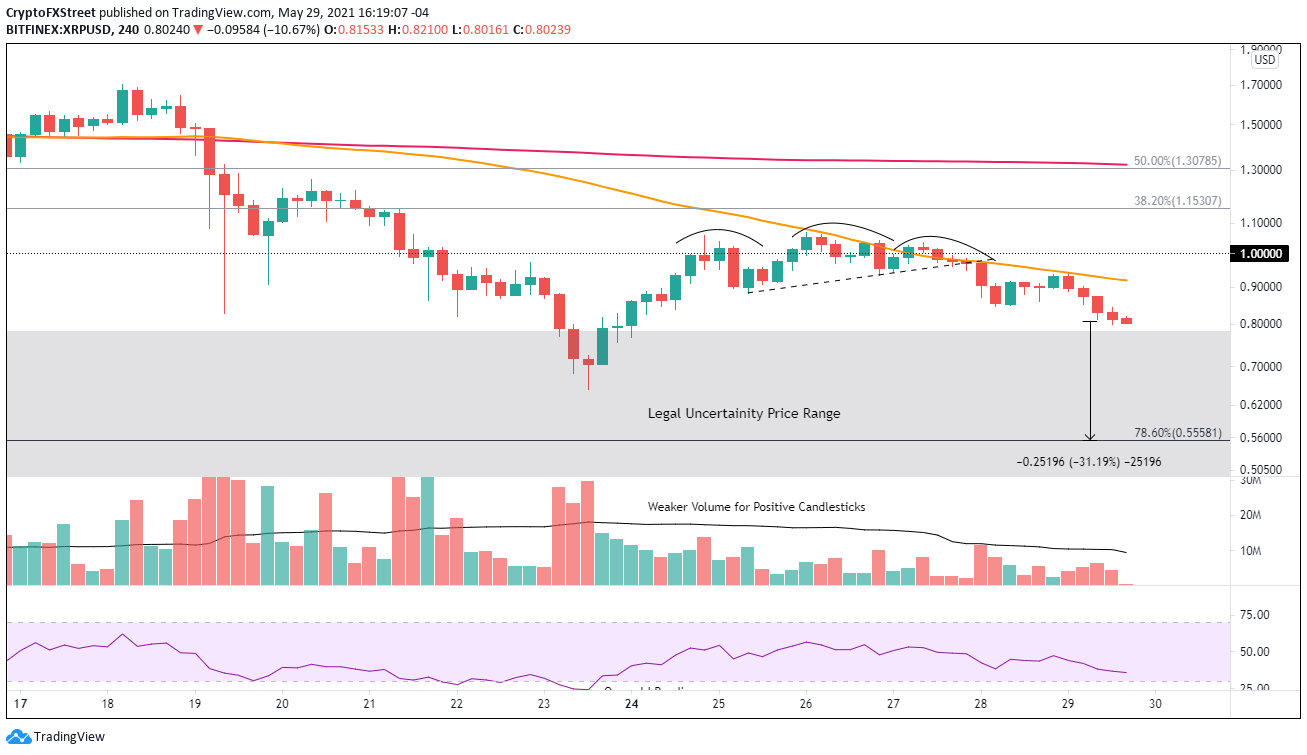
XRP/USD 4-hour chart
To void the bearish narrative, XRP price needs to rally above the right shoulder of the head-and-shoulders pattern at $1.036. It would motivate Ripple to test the 38.2% retracement of the April-May decline at $1.153. Further upside will be complicated by the convergence of the 50% retracement level at $1.307 with the 200 four-hour SMA at $1.338.
Despite a series of business milestones, the threatening SEC case dictates that XRP price will be predominately influenced by the sentiment of the broader cryptocurrency market and the price action of the bellwether cryptocurrencies, Bitcoin and Ethereum.
Author

Sheldon McIntyre, CMT
Independent Analyst
Sheldon has 24 years of investment experience holding various positions in companies based in the United States and Chile. His core competencies include BRIC and G-10 equity markets, swing and position trading and technical analysis.