XRP Price Prediction: Ripple range-bound, spotlights opportunity for swing traders
- XRP price negotiates a rebound from the intersection of the 50-week simple moving average (SMA) with a key Fibonacci level.
- Ripple encounters heavy resistance at $0.650, a level fortified by the May low and earlier weekly peaks.
- Daily Relative Strength Index (RSI) does stamp the first oversold condition since the December 2020 crash.

XRP price did engineer a 35% gain from the June 22 low to the June 24 high, but it was unremarkable in conviction as volume fell well below average. Further upside is resisted by the juncture of the 200-day SMA and the anchored VWAP from December 29, 2020. Unless the international settlements token can be inspired, it is advantageous for investors to remain on the sidelines. On the other hand, it may become the perfect environment for swing traders.
XRP price exposes strengths and weakness in plain sight
At the June 22 low, XRP price had declined 70% from the April high of $1.96 and a noticeable 50% from the June 1 high while liquidating the May 23 low of $0.652, a level fortified by weekly highs in late 2020 and February 2021. Nonetheless, Ripple realized three important technical milestones that provoked a 35% rebound: a test of the 78.6% retracement of the December 2020-April 2021 advance at $0.555, an undercut of the 50-week SMA at $0.540 and registered an oversold reading on the daily RSI for the first time since late December 2020.
Moving forward, it has become more apparent that XRP needs more than a daily close above $0.652 to confirm a solid price low and revolutionize Ripple for a test of the resistance defined by the coupling of the 200-day SMA at $0.728 with the anchored VWAP from December 29, 2020, at $0.740. Moreover, the neckline of a multi-year inverse head-and-shoulders pattern rests at $0.760, establishing another obstacle.
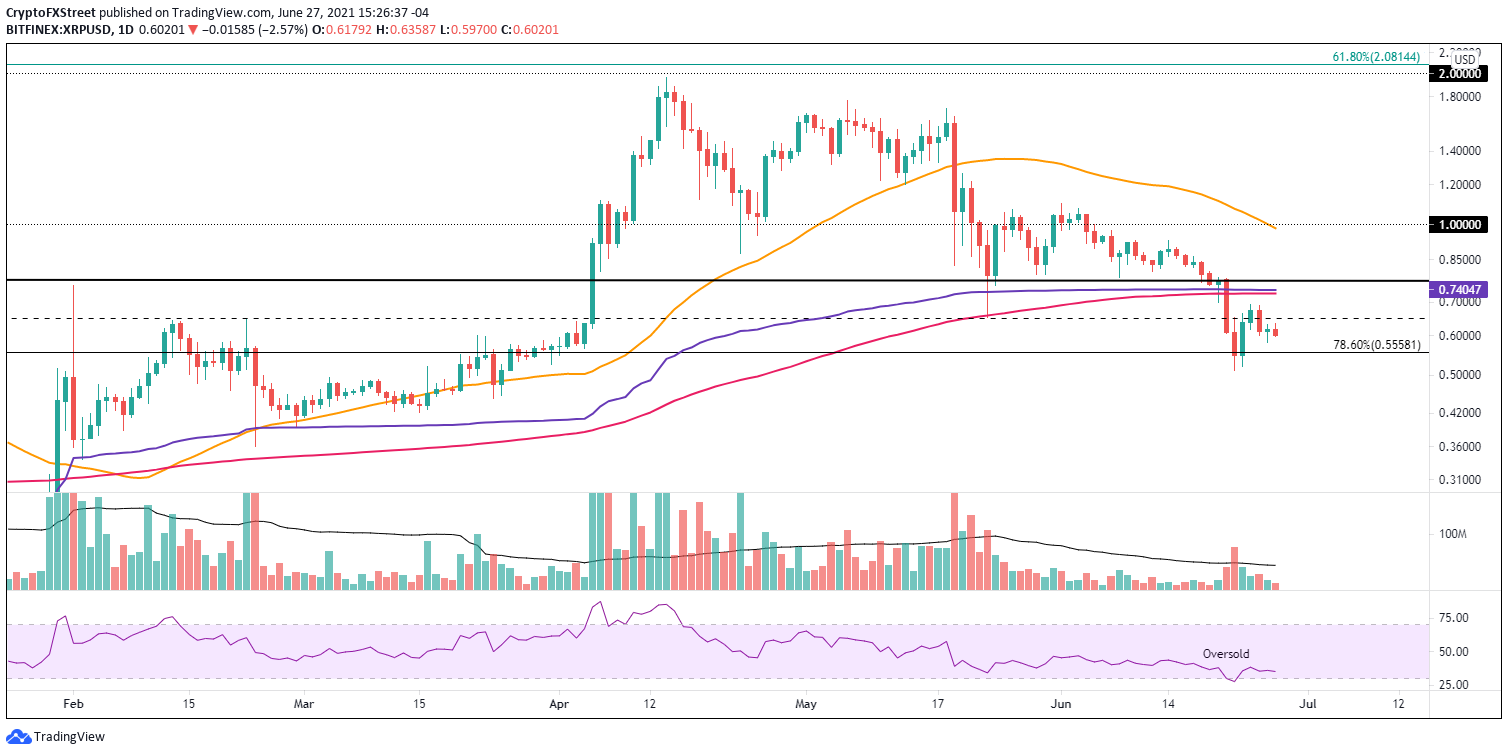
XRP/USD daily chart
XRP price will not be free until a daily close above $0.760, and it will be a struggle to accomplish the feat in the context of an insecure cryptocurrency complex. However, if achieved, Ripple can expect a rally to the confluence of the declining 50-day SMA at $0.980 with the psychologically important $1.00.
A weekly close below the 50-week SMA introduces a new potential outcome for XRP price. It may signal that Ripple will complete a full reversion to the mean and test the 200-week SMA at $0.449. A drop to the mean would equal a 25% decline from the current price. Interestingly, on June 22, it came within 12% of the moving average. Thus, it is not a stretch if the broader market suffers more selling.
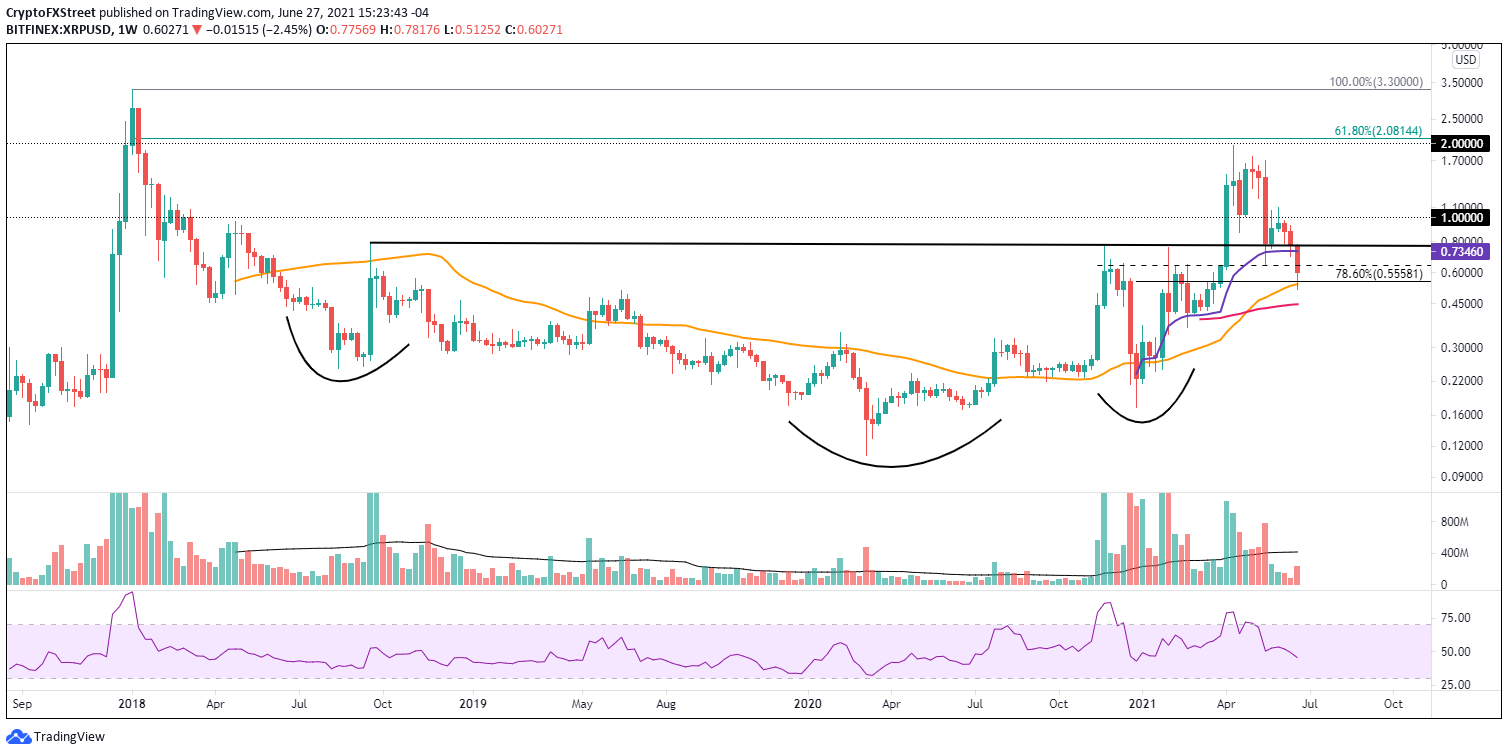
XRP/USD weekly chart
Moving forward, XRP price may choose to trade between the 50-week SMA at $0.540 and the resistance around $0.740. It would grant ideal trading conditions for swing traders due to the bulking support and resistance levels and the resulting 30% profit opportunities that lie between.
Author

Sheldon McIntyre, CMT
Independent Analyst
Sheldon has 24 years of investment experience holding various positions in companies based in the United States and Chile. His core competencies include BRIC and G-10 equity markets, swing and position trading and technical analysis.


