XRP price may suffer another 25% downswing unless it regains crucial support
- Ripple risks a massive breakdown to $0.28 due to the formation of a symmetrical triangle pattern.
- XRP’s network growth has dropped by 65.9% as token intake reduces across its markets.
- In the event the price breaks above the upper trendline, XRP could soar to $0.5.

Ripple embarked on a wild rollercoaster ride this week, soaring to highs above $0.75 for the first time in 2021. However, as reported, the token was dumped massively shortly after the exciting upswing. XRP seems to have secured a pit stop support at $0.35, but the technical outlook suggests that XRP may be in for another 25% trip downhill.
XRP to lose another listing as PrimeXBT cites liquidity challenges
XRP has been a ‘train wreck’ since the US Securities and Exchange Commission (SEC) filed a lawsuit against the issuing company Ripple Labs Inc. and its top officials. The regulator claims that Ripple sold unregistered tokens to investors.
Multiple exchanges, including Coinbase, resulted in delisting XRP, citing regulatory compliance issues. However, PrimeXBT says that there have been “significant events surrounding Ripple” and a lack of support from its liquidity providers.
As of “Wednesday, February 10, 2021, at 15:00 (UTC),” the XRP/USD and XRP/BTC will cease trading on the platform. A “reduce only” status will be utilized ahead of the removal until 15:00 UTC on Wednesday.
Ripple recovery faces significant resistance
The 4-hour chart shows XRP trading within a narrow range between $0.35 and $0.4. Selling orders are poised to surge, especially if XRP closes the day above the range limit. On the downside, support at the 50 Simple Moving Average ($0.35) must stay put to avert potential losses toward $0.3.
The Moving Average Convergence Divergence has validated the pessimistic outlook. The MACD line (blue) recently crossed beneath the signal line, hinting that the breakdown is far from over. Until the MACD reverses the trend, crossing above the signal line, XRP’s upward movement will remain capped.
Simultaneously, the Relative Strength Index brings to light a dominating sideways trading action, as it levels at the midline. The motion under the average level will call for more sell orders.
%20(86)-637479271558855526.png)
XRP/USD 4-hour chart
Similarly, short-term analysis suggests that Ripple is getting closer to a 25% downswing, eyeing $0.28. The formation of a symmetrical triangle pattern hints at a break from the prevailing consolidation. This pattern is created by drawing a descending trendline to connect a series of lower highs. At the same time, the asset’s higher lows are connected using an ascending trendline.
Price action from the pattern can either be a breakout or a breakdown. A breakout occurs when the price crosses above the upper trendline. On the other hand, a breakdown happens when the price hits levels under the lower trendline. Both the breakout and the breakdown have an exact target measured from the triangle’s highest to lowest points.
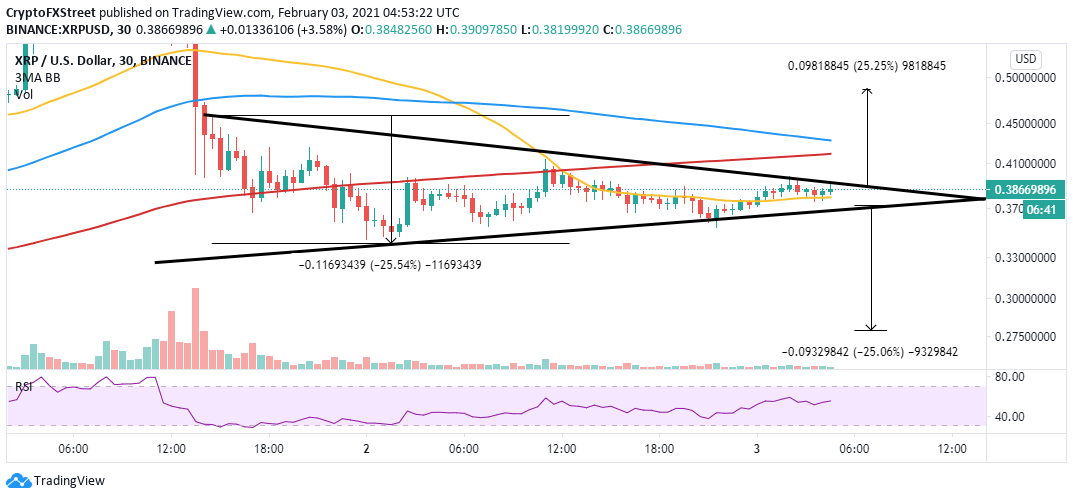
XRP/USD 30-mins chart
The pessimistic outlook can be reinforced by Santiment’s network growth on-chain metric, which measures the number of new addresses joining the XRP protocol daily. The metric topped out on February 1 at approximately 12,600 addresses but has dropped sharply in just two days to roughly 4,300, representing a 65.9% decline.
The massive drop suggests less uptake of XRP in the market, primarily due to the price drop. If the network growth fails to recover, XRP could continue to drop in value toward $0.28. Low network growth is also a bearish signal for the mainstream adoption of the project.
%20[08.13.28,%2003%20Feb,%202021]-637479271666671852.png)
Ripple Network growth
Looking at the other side of the picture
XRP could also ignore the downswing and instead rally 25% toward $0.5. As mentioned, a break above the symmetrical upper trendline may result in upward price action. Moreover, a daily close of $0.4 could call for ore buy orders, creating enough volume to support the uptrend.
Author

John Isige
FXStreet
John Isige is a seasoned cryptocurrency journalist and markets analyst committed to delivering high-quality, actionable insights tailored to traders, investors, and crypto enthusiasts. He enjoys deep dives into emerging Web3 tren


