|

XRP price is setting up for a sharp decline toward $0.40, here's why

  • XRP price is facing significant resistance near $0.50.
  • Ripple shows a tapered volume look, suggesting the uptrend is losing strength.
  • Invalidation of the bearish thesis is a breach above $0.51.

XRP price could witness a sell-off into the mid $0.40 levels if the bulls hurdle through the $0.50 barrier. 

XRP price may be losing steam

XRP's failure to maintain momentum over the $0.50 threshold may result in Ripples' demise. 

In contrast to the last bull run that propelled XRP into the current price levels, the volume pattern throughout the last three attempts to overcome the $0.50  has been dropping. This is a subtle indicator that the upward trend is waning.

XRP is currently trading at $0.499 as another attempt is being made to hurdle the barrier. Still, the volume pattern maintains a relatively sparse look, suggesting retail traders alone may be pushing the price. If this is the case, a liquidation towards $0.47 and potentially $0.40 (if $0.47 does not hold) could occur in the coming days. The Relative Strength Index confounds this idea as a clear bearish divergence is shown as the XRP price ascends and attempts to rally through $0.50

tm/xrp/10/6/22

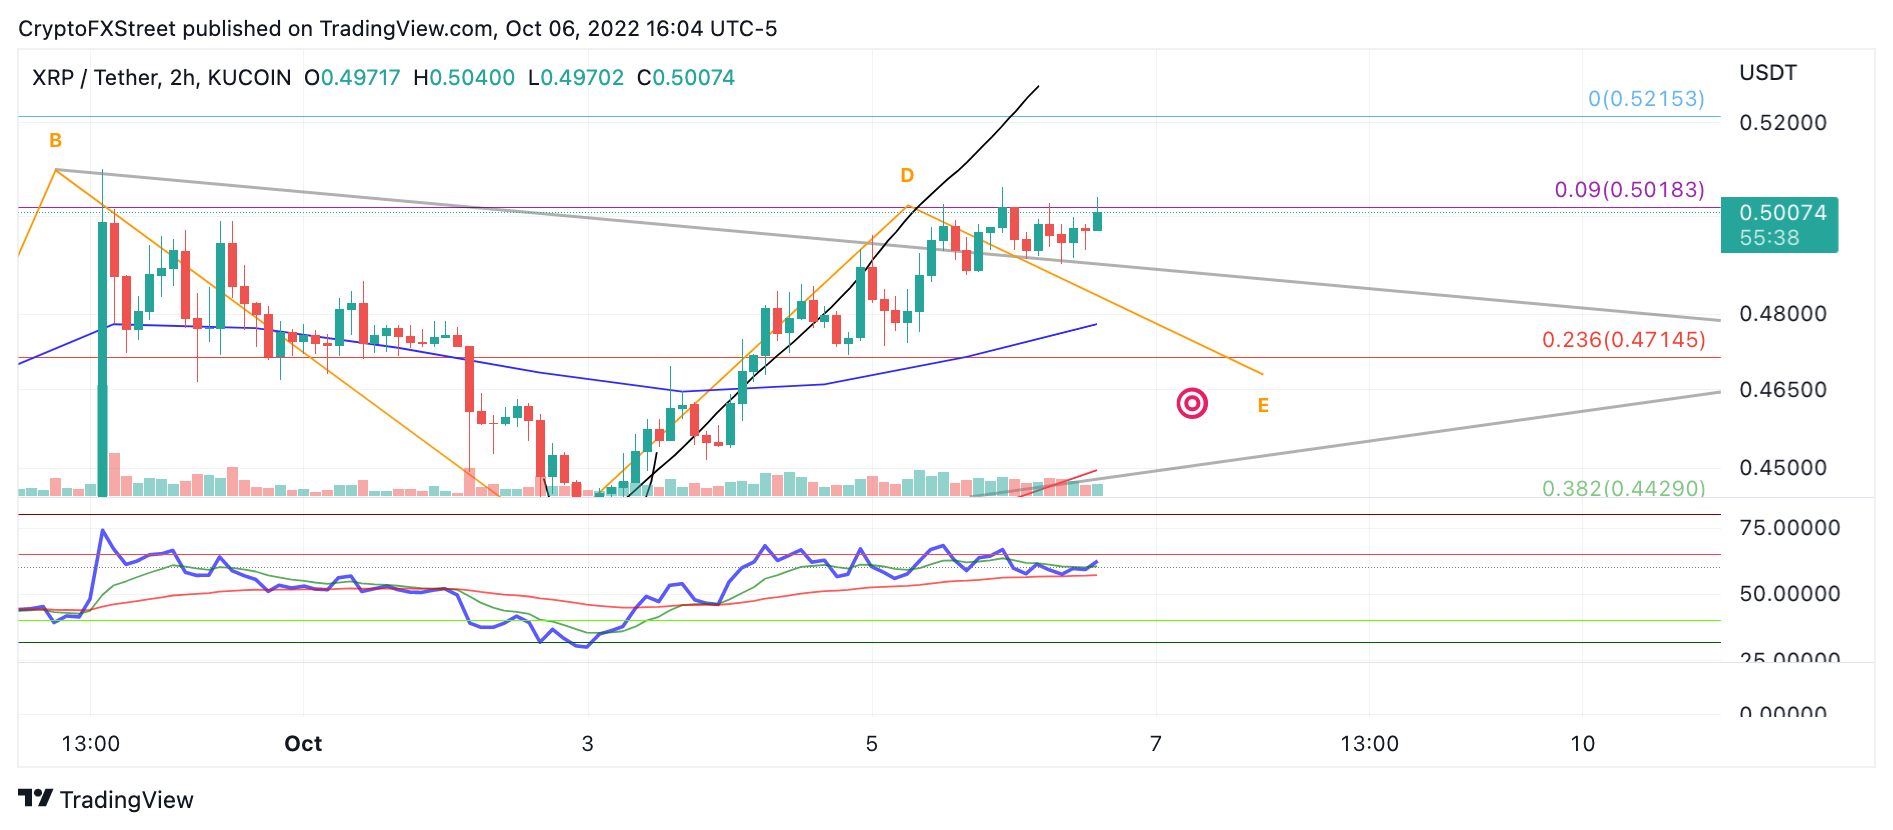
XRP/USDT 2-Hour Chart

Invalidation of the bearish thesis can occur if the bulls breach the $0.51 level. In doing so, a buyers' frenzy targeting $0.56 could occur, resulting in an 11% increase from the current XRP price.

In the following video, our analysts deep dive into the price action of Ripple, analyzing key levels of interest in the market. -FXStreet Team

Author

Tony M.

Tony M.

FXStreet Contributor

Tony Montpeirous began investing in cryptocurrencies in 2017. His trading style incorporates Elliot Wave, Auction Market Theory, Fibonacci and price action as the cornerstone of his technical analysis.

More from Tony M.
Share:

Editor's Picks

Top Crypto Losers: Zcash, Stacks, BNB drop further as Bitcoin weakens

Zcash, Stacks, and BNB (formerly Binance Coin) are among the biggest losers over the last 24 hours as Bitcoin approaches $72,000. The correction is driven by multiple factors, including massive, steady outflows from institutions and large-wallet investors, broader-market risk-off sentiment, and the delay in the Digital Asset Clarity Act.

Bitcoin Price Forecast: BTC steadies as bears shift focus toward $70,000

Bitcoin price remains under pressure so far this week, with the Crypto King slipping below $73,000 on Tuesday for the first time since November 2024. The price dip in BTC was fueled as the news came in late Tuesday that the US military shot down an Iranian drone that “aggressively” approached the USS Abraham Lincoln aircraft carrier in the Arabian Sea. 

Stellar Price Forecast: Correction deepens with bearish signals prevailing

Stellar (XLM) price is extending its correction, trading below $0.167 at the time of writing on Thursday after being rejected at a key level. The derivatives data shows signs of weakness, with XLM’s short bets rising amid falling Open Interest.

Ethereum Price Forecast: ETH faces heavy distribution as price slips below average cost basis of investors

Ethereum (ETH) extended its decline on Wednesday, dropping more than 5% over the past 24 hours toward the $2,100 level, which is below the $2,310 average cost basis or realized price of investors, according to CryptoQuant's data.

Bitcoin Price Annual Forecast: BTC holds long-term bullish structure heading into 2026

Bitcoin (BTC) is wrapping up 2025 as one of its most eventful years, defined by unprecedented institutional participation, major regulatory developments, and extreme price volatility.

Bitcoin: BTC correction deepens as Fed stance, US-Iran risks, mining disruptions weigh

Bitcoin (BTC) price extends correction, trading below $82,000 after sliding more than 5% so far this week. The bearish price action in BTC was fueled by fading institutional demand, as evidenced by spot Exchange-Traded Funds (ETFs), which recorded $978 million in inflows through Thursday.