XRP price recovery stalls leaving Ripple vulnerable to test $0.83
- XRP price stalls for consecutive days at the May 13 low at $1.20.
- Ripple on pace to close with the largest weekly loss since December 2020.
- Daily and weekly Relative Strength Indexes (RSI) no longer show overbought levels.

XRP price declined almost 60% from the April 14 high at $1.96 to the March low at $0.82, culminating in one of the worst daily declines in Ripple price history at 33.43%. Unlike other widely followed cryptocurrencies, the cross-border remittances token rests precariously close to the crash low, leaving it vulnerable for a test or drop below.
XRP price rebound lacks commitment and emotion
XRP price had delivered a challenging trading environment since the April high, but charts began to clarify the notable volatility into a wide symmetrical triangle pattern. On May 18, Ripple tried to release from the triangle but was quickly rejected, creating a bull trap.
Like all digital tokens, the XRP price was overwhelmed by the selling contagion that struck the crypto market, generating a 50% decline for Ripple at the May 19 low. It was a significant technical development for Ripple highlighted by the smashing of the symmetrical triangle’s lower trend line and the drop to the convergence of the rising trend line from the December 2020 low at $.87 with the 61.8% Fibonacci retracement of the advance also beginning in December 2020 at $0.85. The combination created an inflection point for evaluating future XRP price weakness.
Due to the Ripple investor profile being tilted to retail investors, there is added volatility during stress periods in the markets. That could arise if the crypto market follows today’s sell-off with something similar on the weekend.
If XRP price does experience another daily loss like today of 16%, it will test the May 19 low, dropping through the trend line and the retracement level mentioned above. It would expose Ripple to a more substantive downturn that could threaten the November 2020 high at $0.78 and the Feburary high at $0.75.
A failure to stabilize at $0.75 shifts the focus to the 200-day simple moving average (SMA) at $0.65, leading to a loss of 30% from the current price of $0.98.
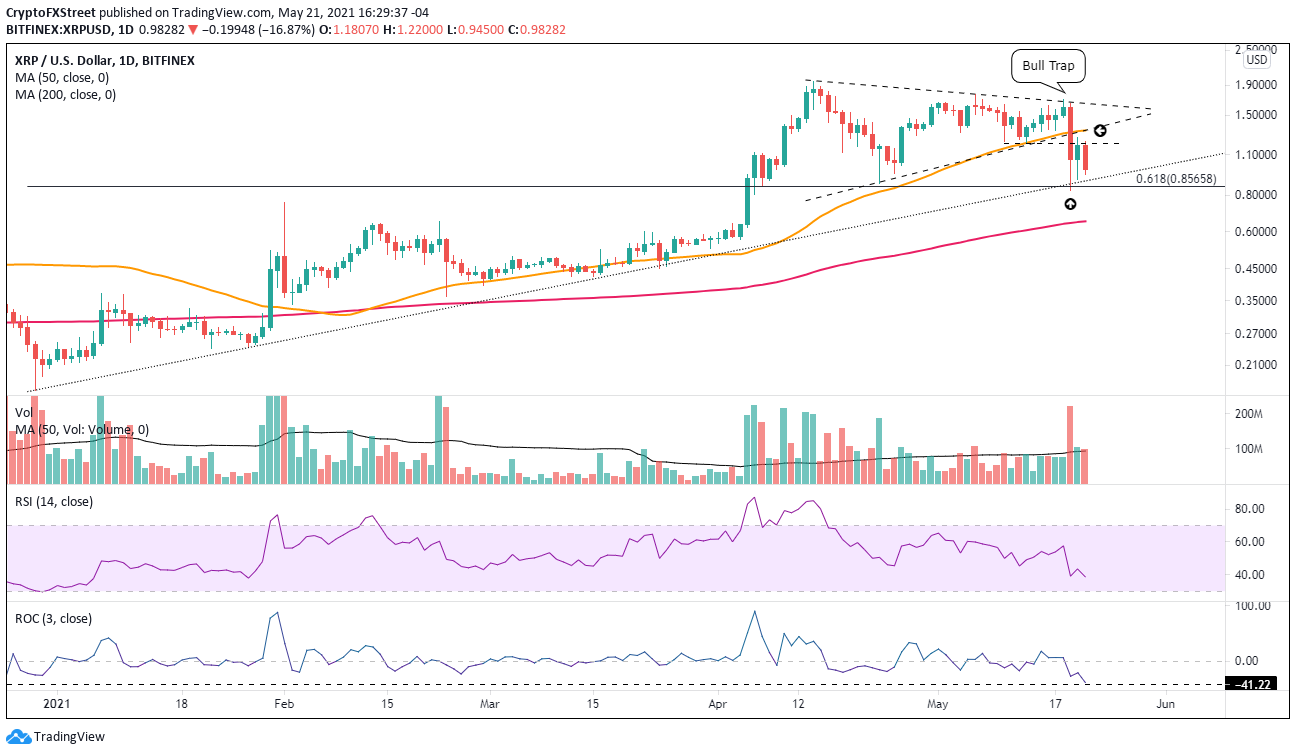
XRP/USD daily chart
The current technical framework for XRP price is tilted bearish. Still, a daily close above $1.20 would initiate a transition in the outlook to neutral that would need to be confirmed by a subsequent daily close above the technical hotspot formed by the intersection of the 50-day SMA with the triangle’s lower trend line at $1.33.
Beyond those levels, XRP price would be free to revisit the triangle’s upper trend line and the May 18 high at $1.70. Friendly RSI readings could facilitate the rebound as if it comes to fruition.
Author

Sheldon McIntyre, CMT
Independent Analyst
Sheldon has 24 years of investment experience holding various positions in companies based in the United States and Chile. His core competencies include BRIC and G-10 equity markets, swing and position trading and technical analysis.


