Ripple Price Prediction: XRP bears tighten grip as speculative demand dwindles
- XRP trades 17% below its record high, held down by risk-off sentiment and increased profit-taking.
- The number of Active Addresses on the XRL Ledger dropped 44% to 28,000, indicating fading speculative demand.
- The XRP derivatives market highlights a sharp drop in funding rates and futures Open Interest.

Ripple (XRP) price displays an upside-heavy outlook on Friday after three consecutive days of declines. Traders appear to be inclined bearishly, highlighting risk-off sentiment after XRP edged higher, hitting a new record high of $3.66 on July 18.
Key indicators suggest that the decline may extend into the weekend, particularly in funding rates and Open Interest (OI) in the derivatives market. XRP’s Active Addresses metric reflects the lack of conviction in the uptrend, which could keep prices suppressed in upcoming sessions.
XRP decline could extend as interest plunges
The level of user engagement on the XRP Ledger (XRPL) has fallen sharply from its recent peak. CryptoQuant’s Active Addresses metric indicates the number of addresses interacting with the protocol by sending or receiving XRP, averaging 28,000, representing a 44% decrease from 50,482, recorded on July 18.
If user engagement continues to drop, speculative demand for XRP would also decrease, depriving the token of the bullish momentum necessary to sustain the uptrend. This also highlights a lack of conviction among token holders as market sentiment turns bearish.
-1753455988336.png)
XRP Active Addresses metric | Source: CryptoQuant
The picture remains mundane in the derivatives market, particularly with the futures Open Interest falling to $9 billion after peaking at $10.94 billion on Tuesday. OI is a measure of the notional value of capital invested in XRP derivatives at any given time.
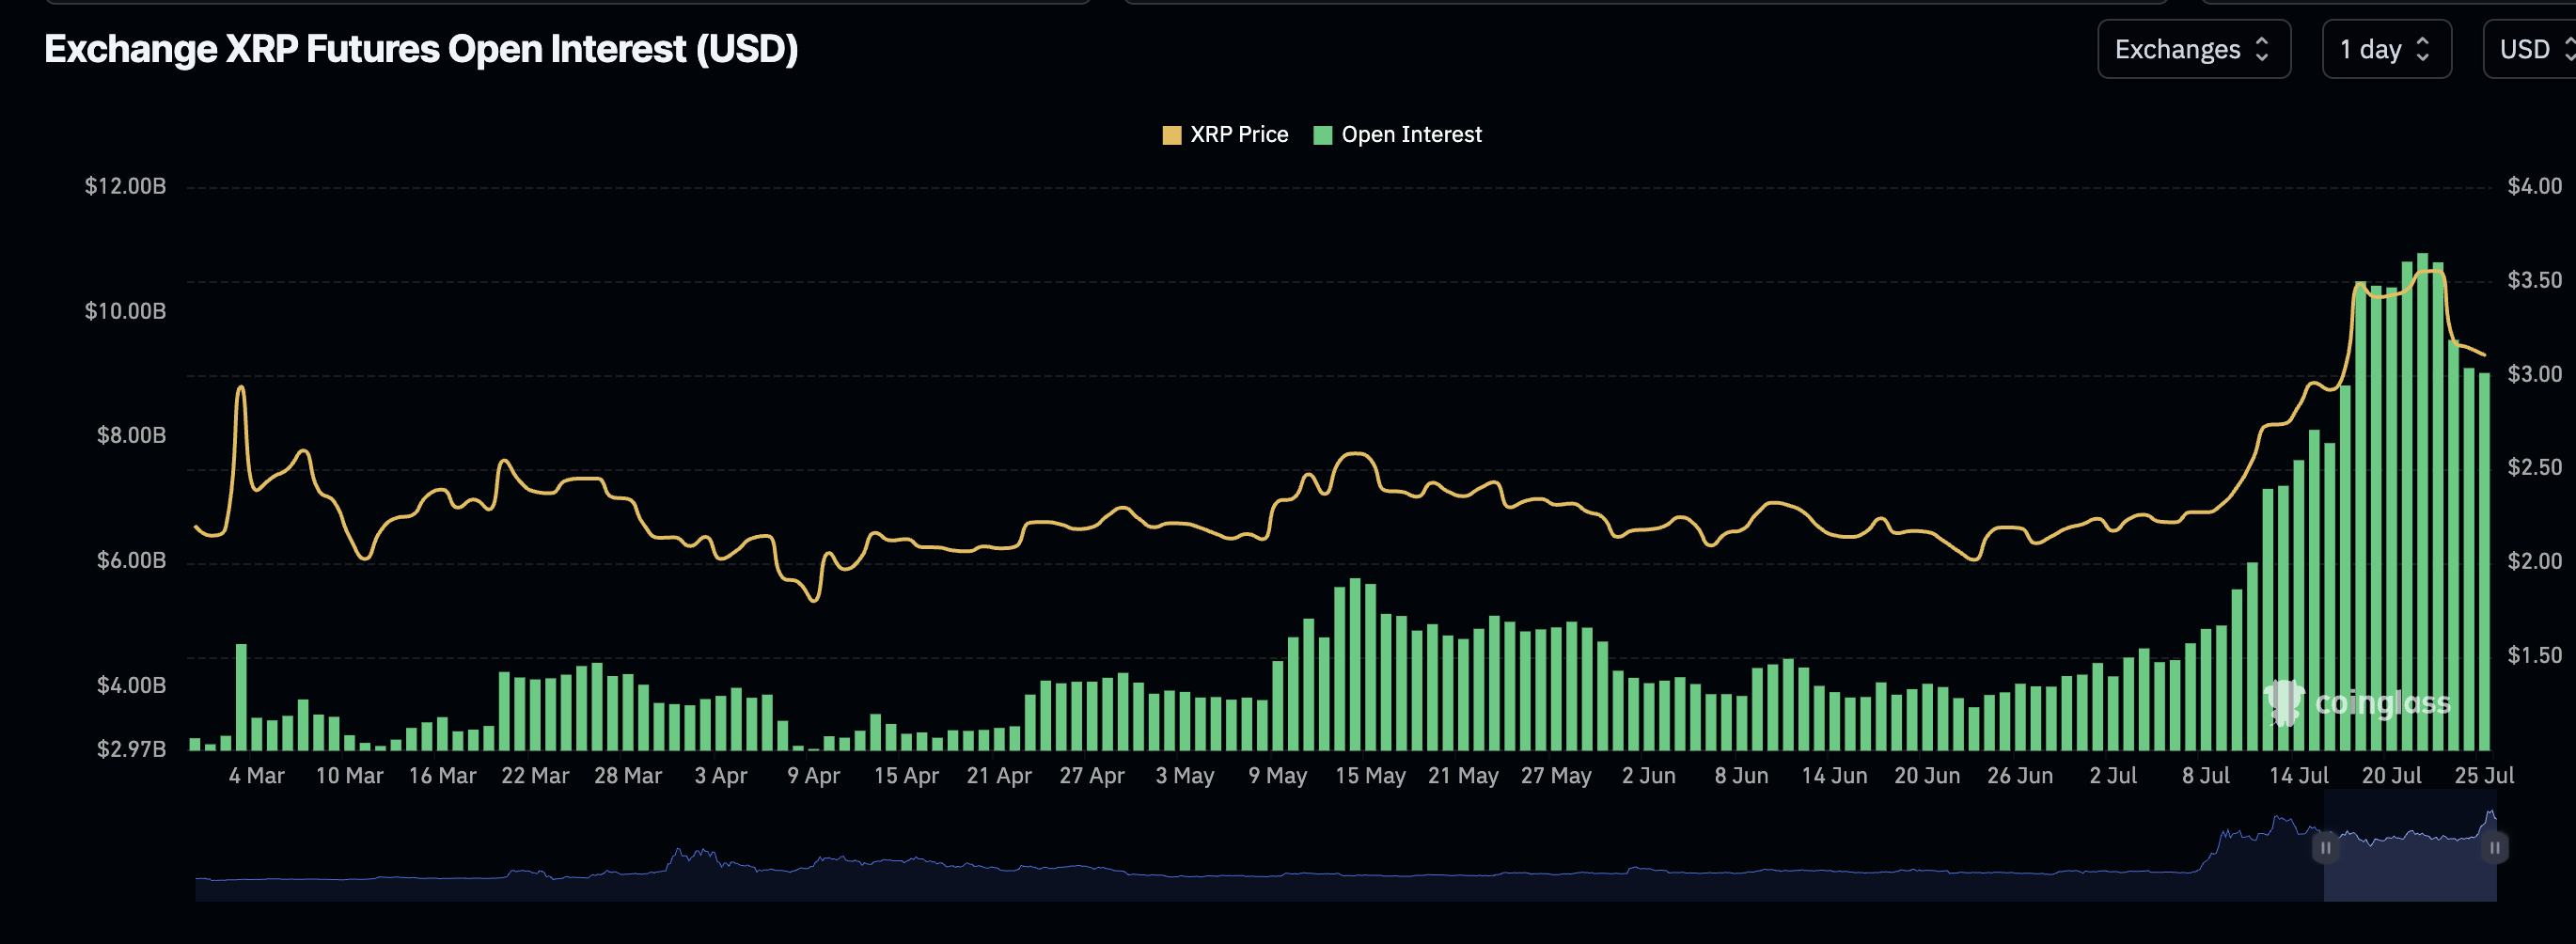
XRP Futures Open Interest | Source: CoinGlass
A persistent decline in OI indicates that trader confidence in the token is fading. Investors may be aligning with a risk-off sentiment and de-risking amid changing market dynamics.
The weighted funding rate chart below confirms the reduction in bullish momentum while signaling a steady increase in bearish sentiment. Key highlights derived from this fundamental indicator suggest that fewer traders are leveraging long positions, bearish sentiment is developing, and an opportunity to buy may arise if investors identify an entry point.
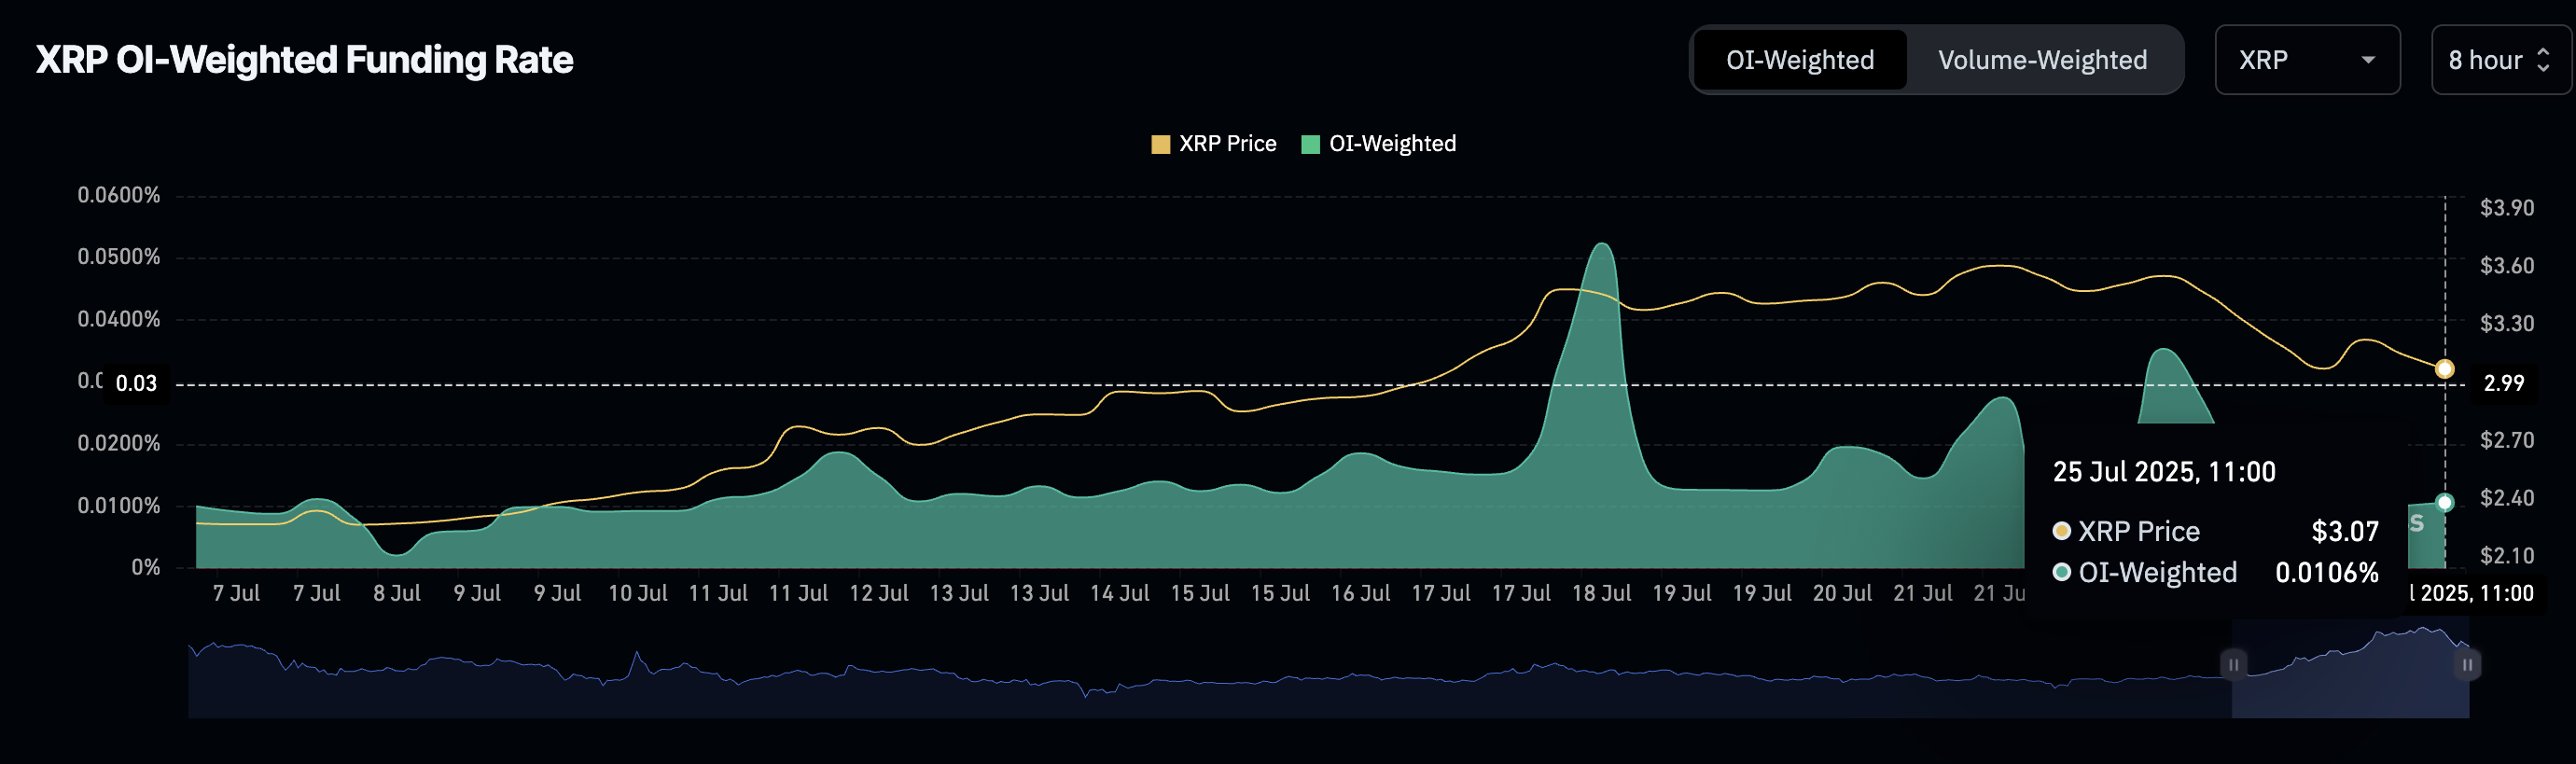
XRP Futures Weighted Funding Rate indicator | Source: CoinGlass
Technical outlook: XRP offers bearish signals
XRP bulls are battling to keep support at $3.00 intact, but key technical indicators suggest that supply could continue to outweigh demand in the short term. The previously overbought Relative Strength Index (RSI) remains downward-facing at 55, reinforcing bearish momentum amid fading buying pressure.
Traders are likely to maintain a risk-off stance, especially with the Moving Average Convergence Divergence (MACD) indicator confirming a sell signal on the daily chart. This call to reduce exposure occurred when the blue MACD line crossed below the red signal line on Friday. Red histogram bars expanding below the zero line, amid a surge in volume, would back the bearish grip.
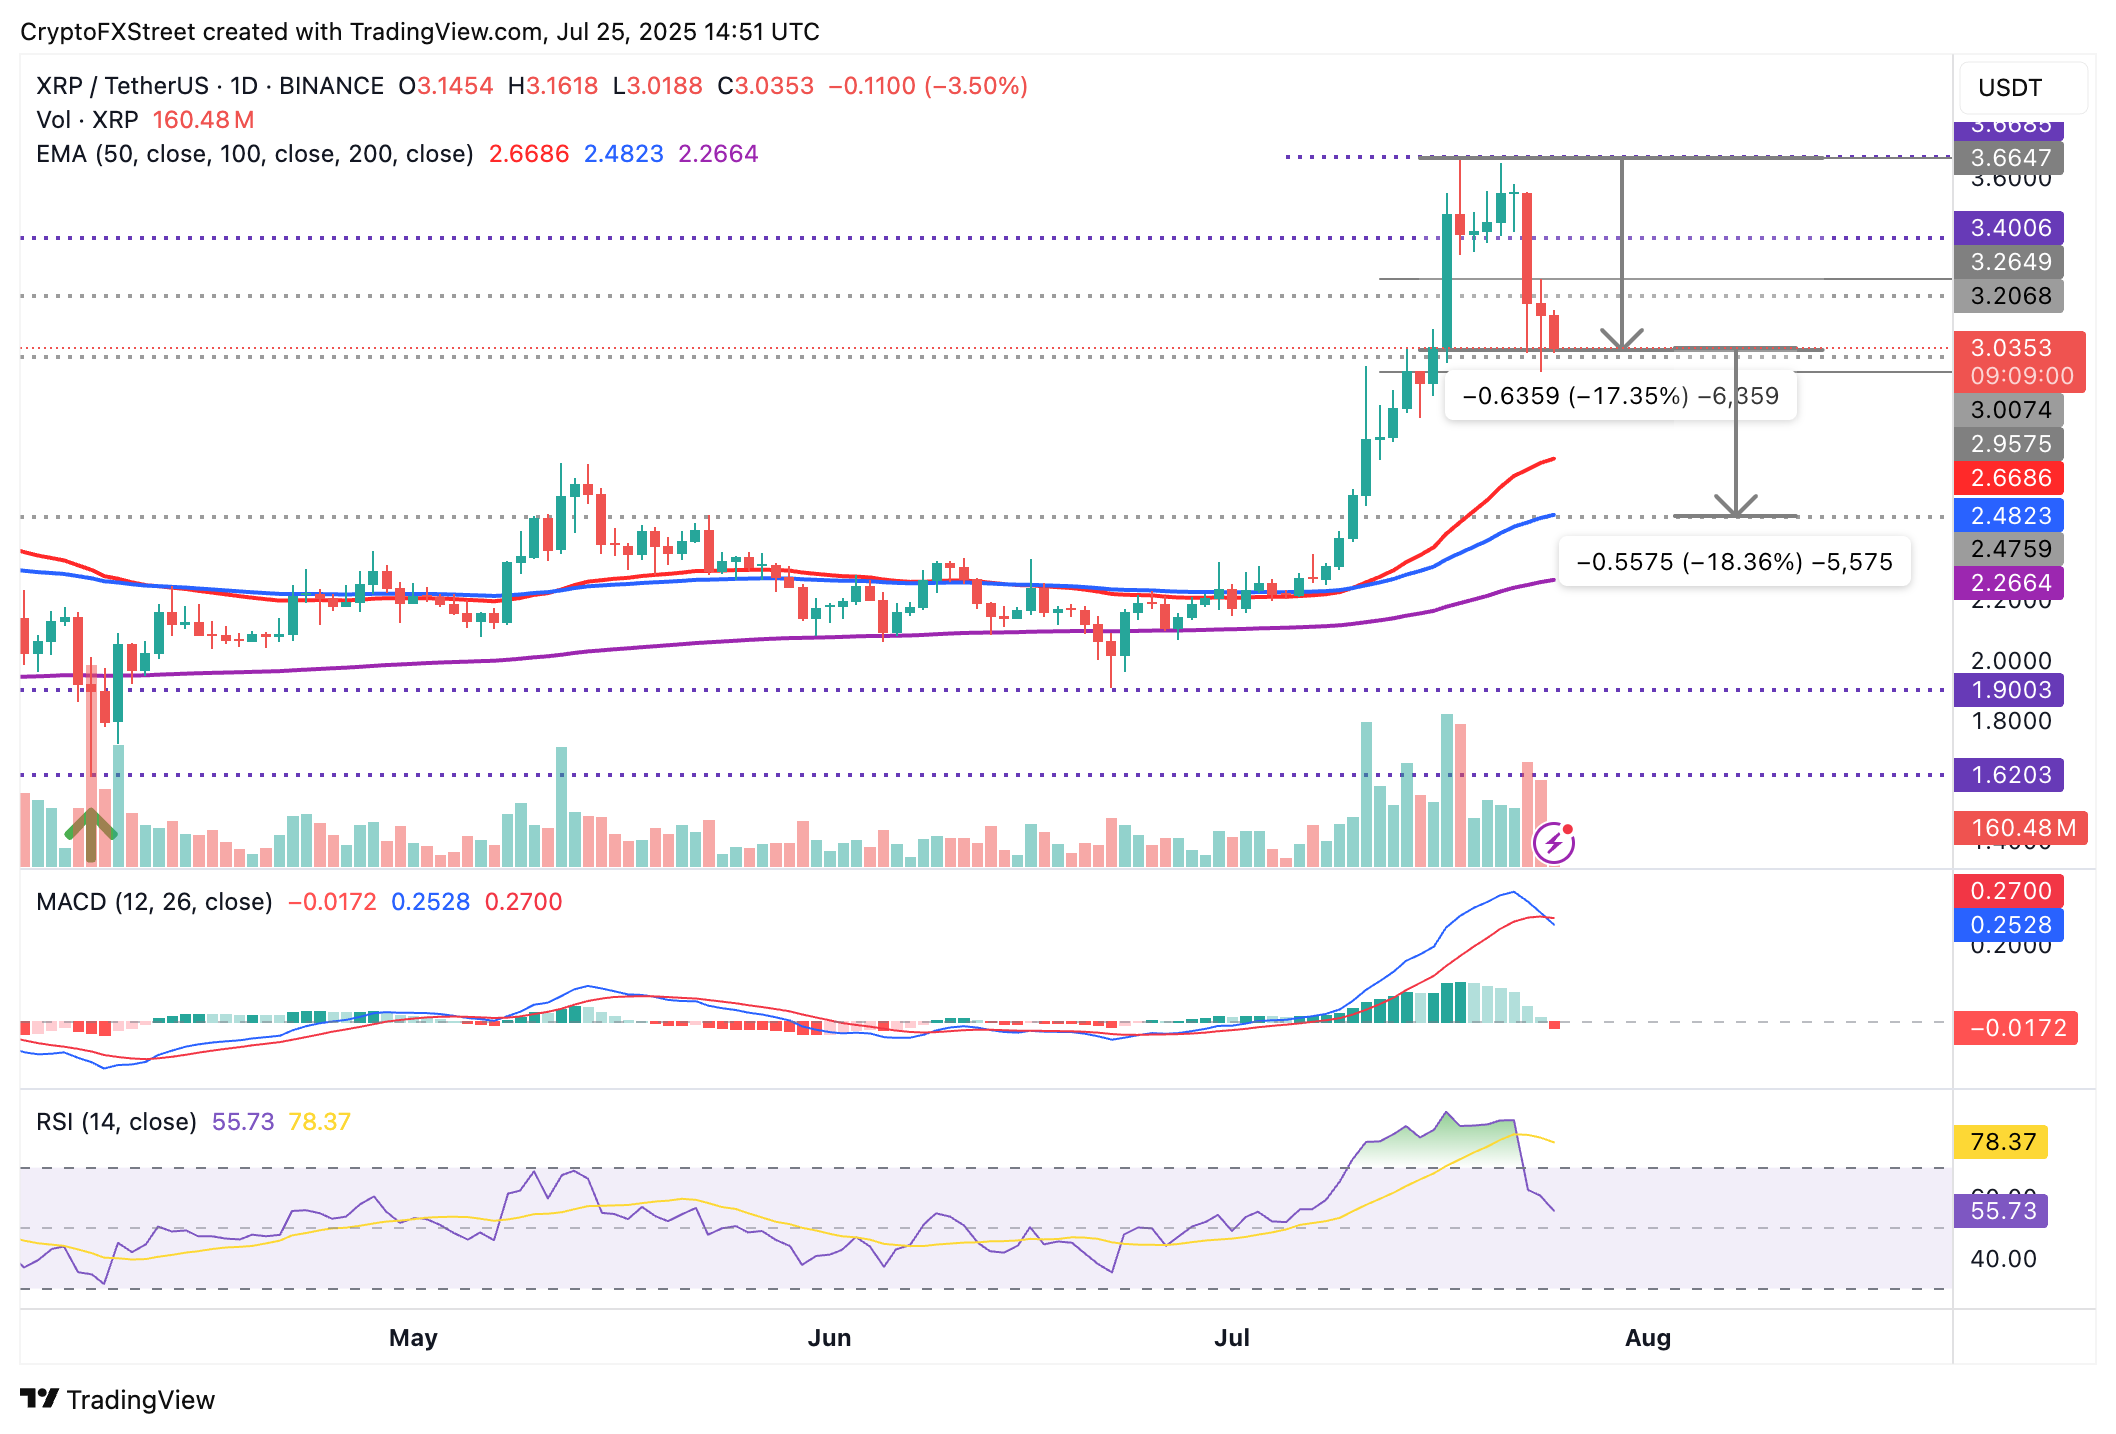
XRP/USDT daily chart
Traders should monitor for price action below the $3.00 near-term support, which could expand the bearish scope 6% to the 50-day Exponential Moving Average (EMA) at $2.66 and 18% to the 100-day EMA at $2.48.
Cryptocurrency metrics FAQs
The developer or creator of each cryptocurrency decides on the total number of tokens that can be minted or issued. Only a certain number of these assets can be minted by mining, staking or other mechanisms. This is defined by the algorithm of the underlying blockchain technology. On the other hand, circulating supply can also be decreased via actions such as burning tokens, or mistakenly sending assets to addresses of other incompatible blockchains.
Market capitalization is the result of multiplying the circulating supply of a certain asset by the asset’s current market value.
Trading volume refers to the total number of tokens for a specific asset that has been transacted or exchanged between buyers and sellers within set trading hours, for example, 24 hours. It is used to gauge market sentiment, this metric combines all volumes on centralized exchanges and decentralized exchanges. Increasing trading volume often denotes the demand for a certain asset as more people are buying and selling the cryptocurrency.
Funding rates are a concept designed to encourage traders to take positions and ensure perpetual contract prices match spot markets. It defines a mechanism by exchanges to ensure that future prices and index prices periodic payments regularly converge. When the funding rate is positive, the price of the perpetual contract is higher than the mark price. This means traders who are bullish and have opened long positions pay traders who are in short positions. On the other hand, a negative funding rate means perpetual prices are below the mark price, and hence traders with short positions pay traders who have opened long positions.
Author

John Isige
FXStreet
John Isige is a seasoned cryptocurrency journalist and markets analyst committed to delivering high-quality, actionable insights tailored to traders, investors, and crypto enthusiasts. He enjoys deep dives into emerging Web3 tren


