XRP price cools off before preparing for its next 100% rally
- XRP price has retraced 15% from its recent swing high at $0.559.
- Investors can expect a steep correction before it triggers its next explosive move.
- A daily candlestick close below $0.384 will invalidate the bullish thesis for Ripple.

XRP price shows an interesting development in the lower time frame that hints at a potential retracement. The higher time frame scenario also entertains the possibility of a deeper pullback after its recent explosive move.
XRP price reveals two reasons for a pullback
XRP price shows a descending triangle formation on the one-hour chart, as seen below. This development could result in a correction for the remittance token. The price action around this setup, when connected using trend lines, describes a descending triangle.
Such patterns have a bearish bias, forecasting a 15% downswing to $0.386, obtained by measuring the distance between the first swing high and swing low and extrapolating it lower from the breakout point at $0.450.
In many ways this short-term outlook makes sense, given the remittance token has rallied a whopping 74% in less than eight days. Such an exponential move is often followed by investors booking profits, which results in a retracement.
Fortunately for XRP price, the midpoint of the 74% rally at $0.449 is just below the breakout point and could slow bearish momentum. However, investors can still expect Ripple to dive further to the 61.8% Fibonacci retracement level at $0.423 or the subsequent barrier at $0.404.
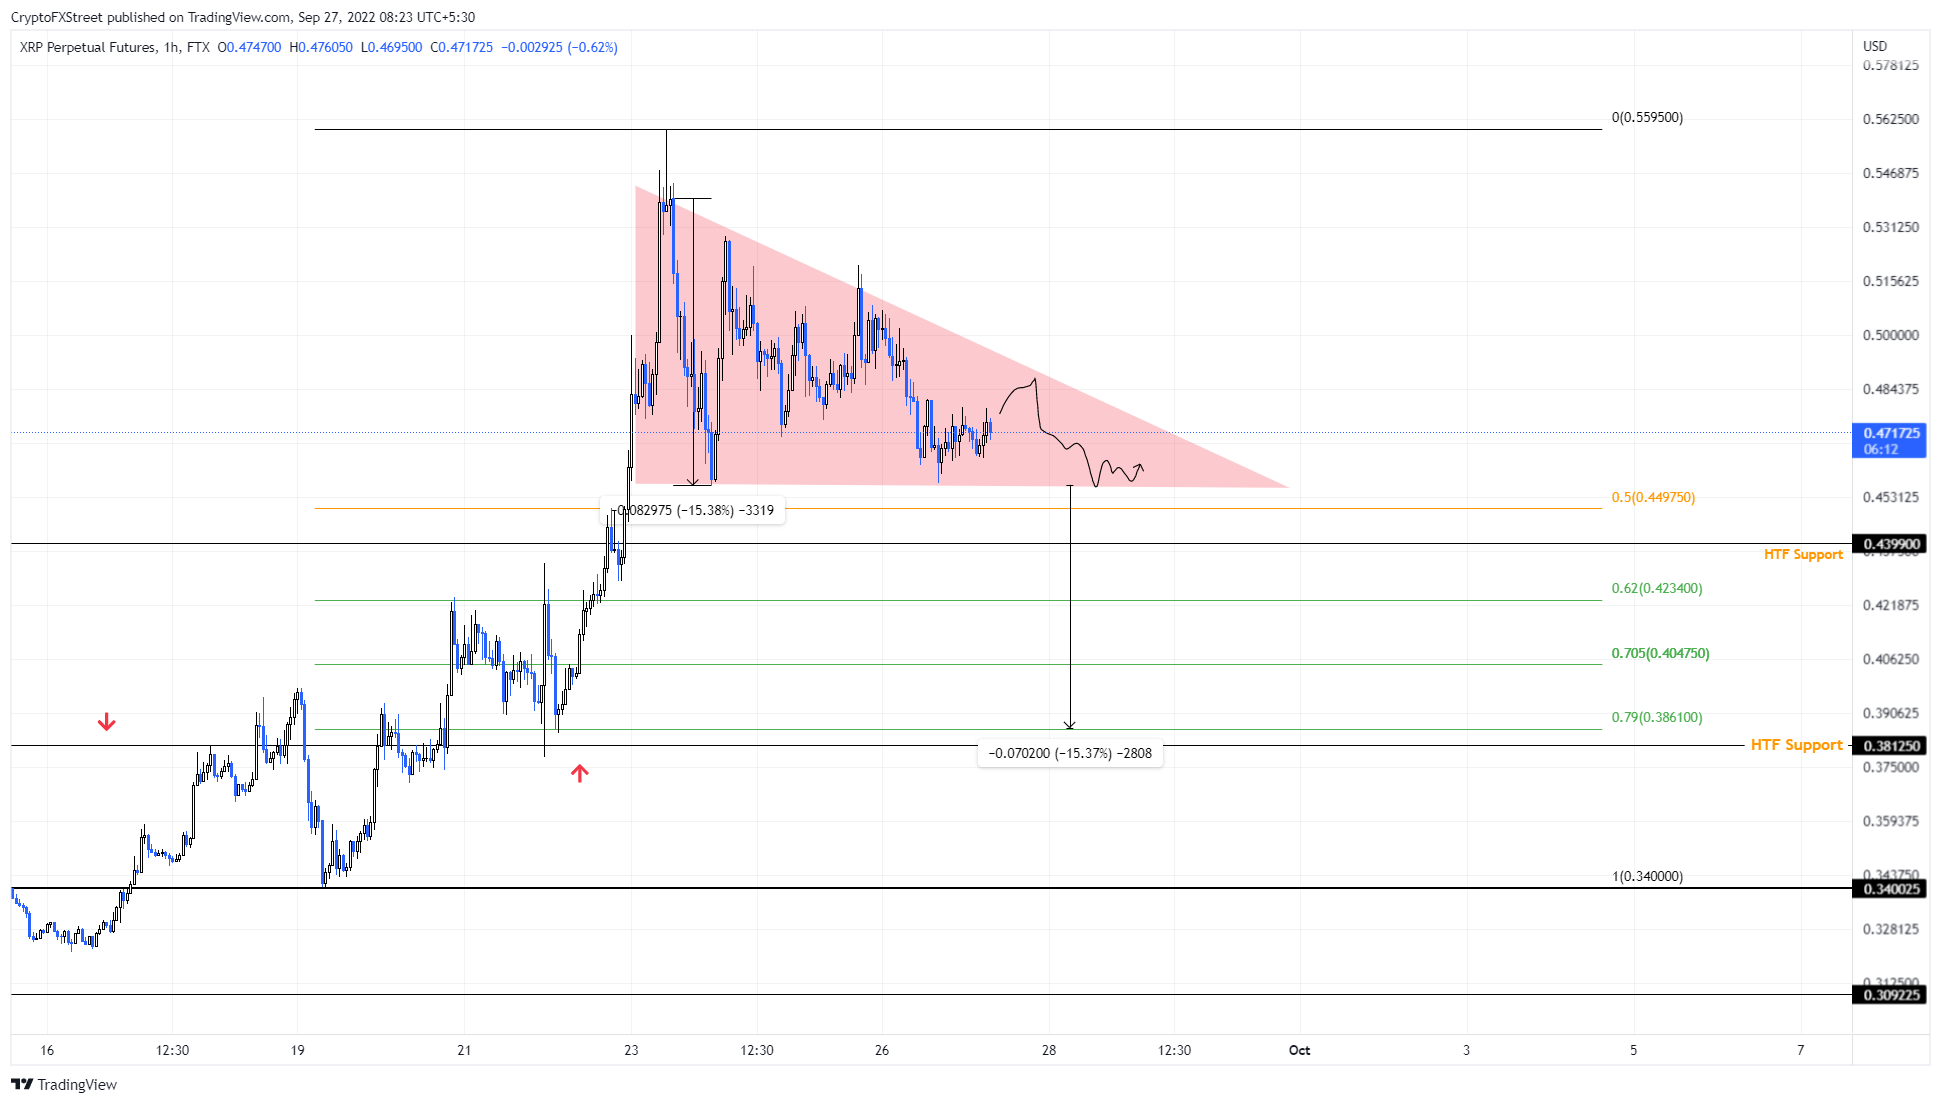
XRP/USDT 1-hour chart
The bullish side of things
However, investors should ideally look at a slightly higher time frame scenario to confirm if XRP price is due to retrace. The chart below shows that XRP price bounced off the $0.331 range low before starting the 74% ascent that came close to retesting the $0.561 to $0.596 resistance area.
Although profit-taking and deteriorating market conditions have knocked XRP price down by roughly 15%, things could escalate if the $0.464 support structure is breached. This development will push XRP price back into the $0.331 to $0.464 range.
The daily demand zone, extending from $0.381 to $0.433, is a crucial foothold to stop this hemorrhaging if it ever occurs. The move down to there represents a 10% sell-off in XRP price, which is not too far off what the short-term outlook forecasts. Whilst investors need to be prepared for a pullback in the remittance token, the level of the daily demand zone could also be a good place to accumulate if price stabilizes and looks like it is reversing there.
Despite bearish forecasts, investors should position themselves on the buy-side and try to take advantage of the pullback to purchase XRP tokens at a discounted price. This development could see stabilization and accumulation, and could be followed by another explosive move up.
Backing this outlook is the recent outlook of Ripple’s Chief Counsel, Stuart Alderoty, regarding the ongoing lawsuit brought by the US Securities and Commission (SEC) against Ripple. Alderoty claims the SEC is posturing and wasting time – delaying an inevitable win for Ripple Labs.
If true, this could see XRP price begin a massive rally that could propel it from $0.464 to the resistance area, extending from $0.561 to $0.596. A flip of this hurdle could result in a sweep of the equal highs at $0.914, which would constitute a 100% run-up in total and is likely where the upside will be capped for the remittance token.
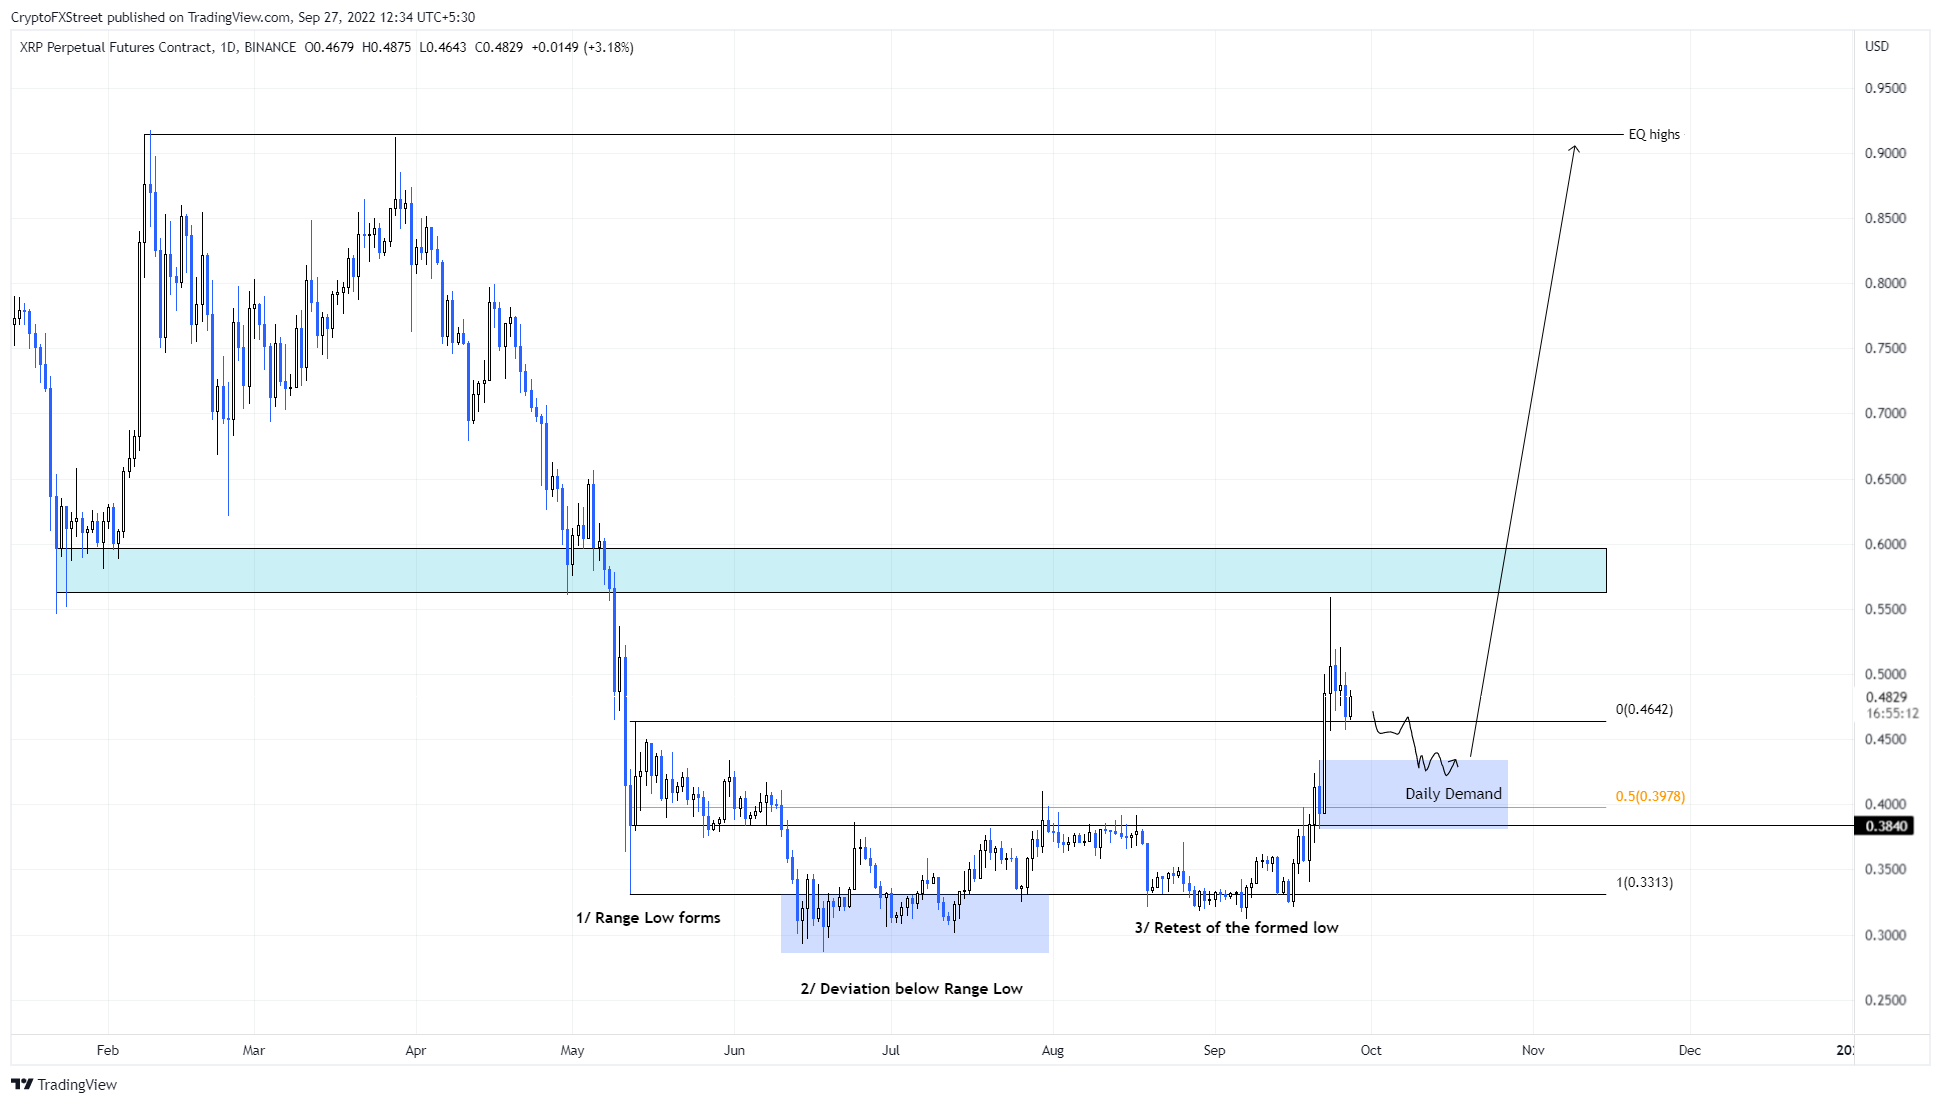
XRP/USDT 1-day chart
On the other hand, if XRP price fails to sustain above the $0.561 to $0.596 demand zone, it will reveal a weakness among buyers and excessive sell-side pressure. In such a case, a daily candlestick close below the $0.384 support level will invalidate the bullish thesis for Ripple. This move could see XRP price drop to the range low at $0.331, where buyers may finally attempt a recovery rally.
Author

Akash Girimath
FXStreet
Akash Girimath is a Mechanical Engineer interested in the chaos of the financial markets. Trying to make sense of this convoluted yet fascinating space, he switched his engineering job to become a crypto reporter and analyst.