XRP price chart 'bull flag' targets $15 amid increasing open interest

XRP (XRP $2.39) price printed a bull flag on the daily chart, a technical chart pattern associated with strong upward momentum. Could this bullish setup and surging open interest signal the start of the second leg of XRP’s rally into the double-digit zone?
Increasing IO boosts XRP price
XRP price is up 15% over the last seven days after weeks of consolidation following the altcoin’s rally toward $3.00 in early December. The XRP/USD pair is up 1.5% to its intraday high of $2.44 on Jan. 6, according to data from Cointelegraph Markets Pro and TradingView.
XRP’s potential to rise higher is backed by increasing open interest (OI), which has increased significantly over the last 24 hours.
The chart below shows that XRP OI has increased by 45% over the last 24 hours from $2.6 billion to $3.7 billion, suggesting that investors are opening positions with the expectation of XRP’s price increase. This also indicates that more trading activity and money entering the XRP market.
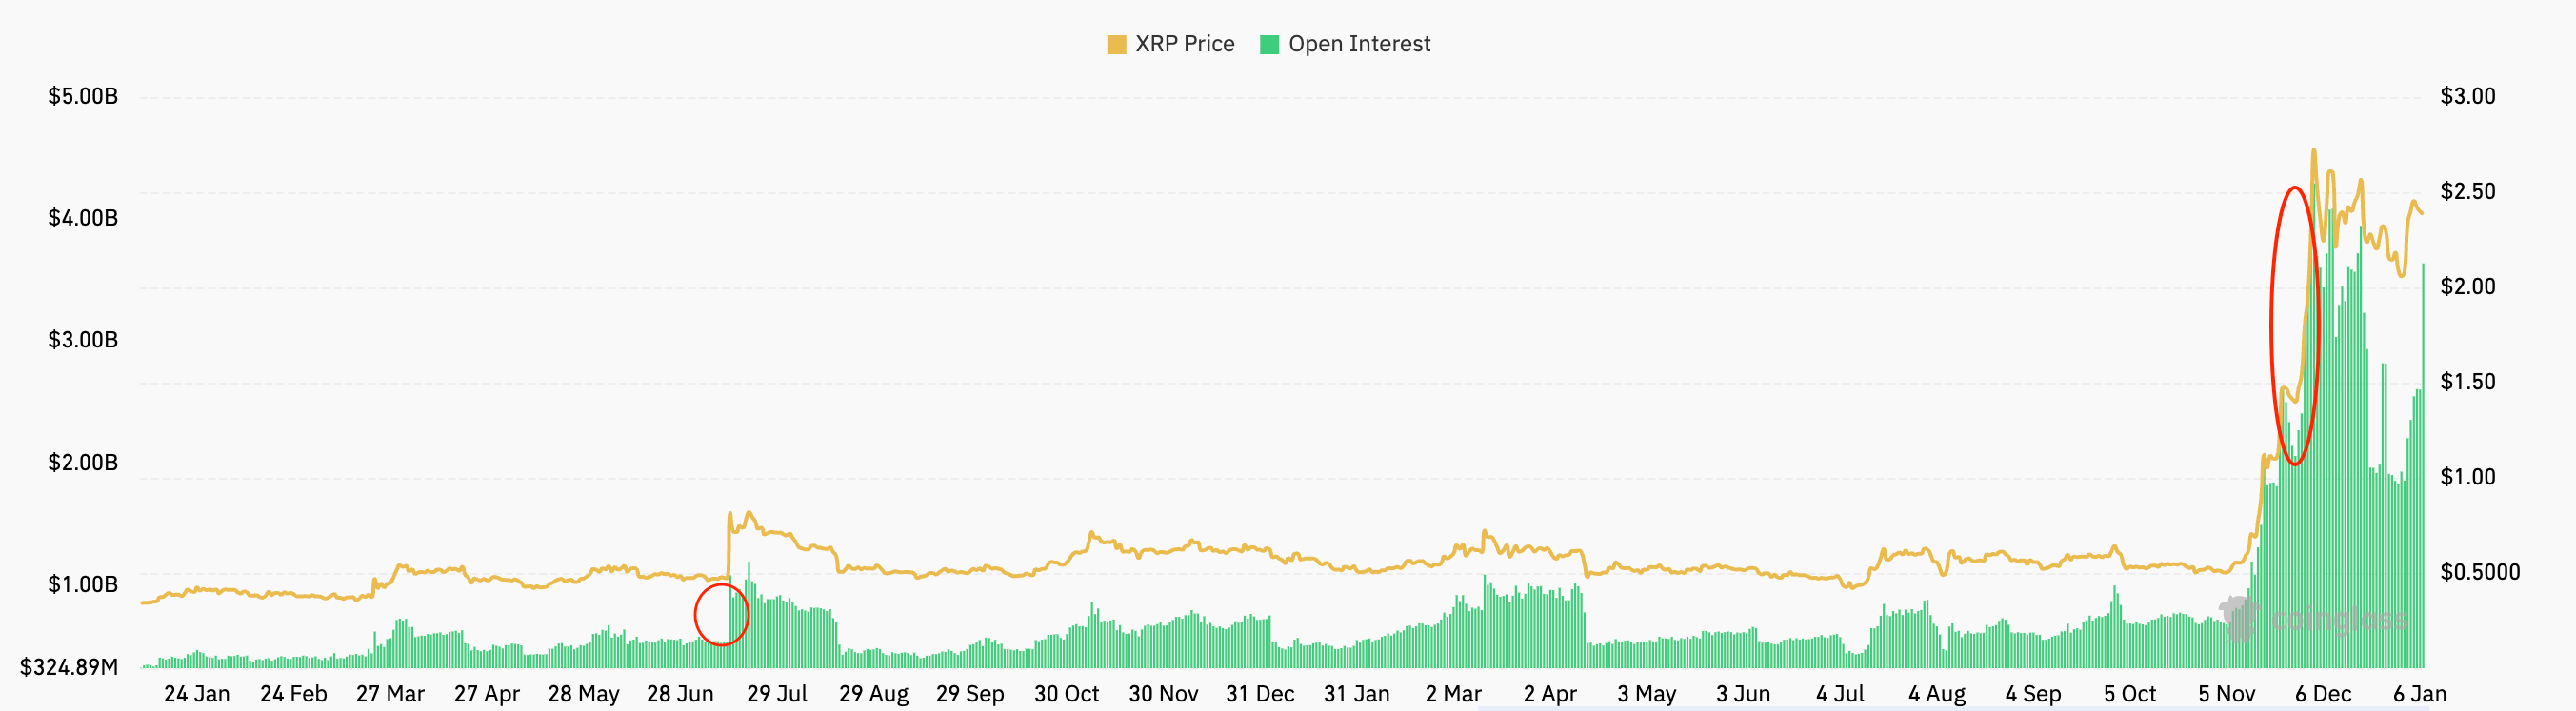
XRP open interest. Source: CoinGlass
Historically, significant jumps in OI interest have preceded dramatic rallies in XRP price.
For example, this metric jumped by over 100% between July 13 and July 14, 2023, triggering a 107% price jump over the same period.
This price action came after Judge Analisa Torres ruled that the XRP token is not a security in the Securities and Exchange Commission lawsuit against Ripple.
Similar price action was witnessed when OI jumped by 76% between Nov. 29 and Dec. 3, 2024, accompanying another 100% jump in price over the same period.
If history repeats itself, the latest surge in OI could see the XRP price breakout of consolidation, recording massive gains toward $15.
XRP price “bull flag” targets $15
The XRP/USD pair is expected to resume its prevailing bullish momentum despite the pullback from recent highs, as the chart shows a classic technical pattern in the making.
XRP’s price action between Nov. 5, 2024, and Jan. 6, 2025, has led to the formation of a bull flag pattern on the daily chart, as shown in the figure below. A daily candlestick close above the flag’s upper boundary at $2.41 would signal the start of a massive upward breakout.
The target is set by the flagpole’s height, which comes to be around $15, an approximately 520% uptick from the current price.
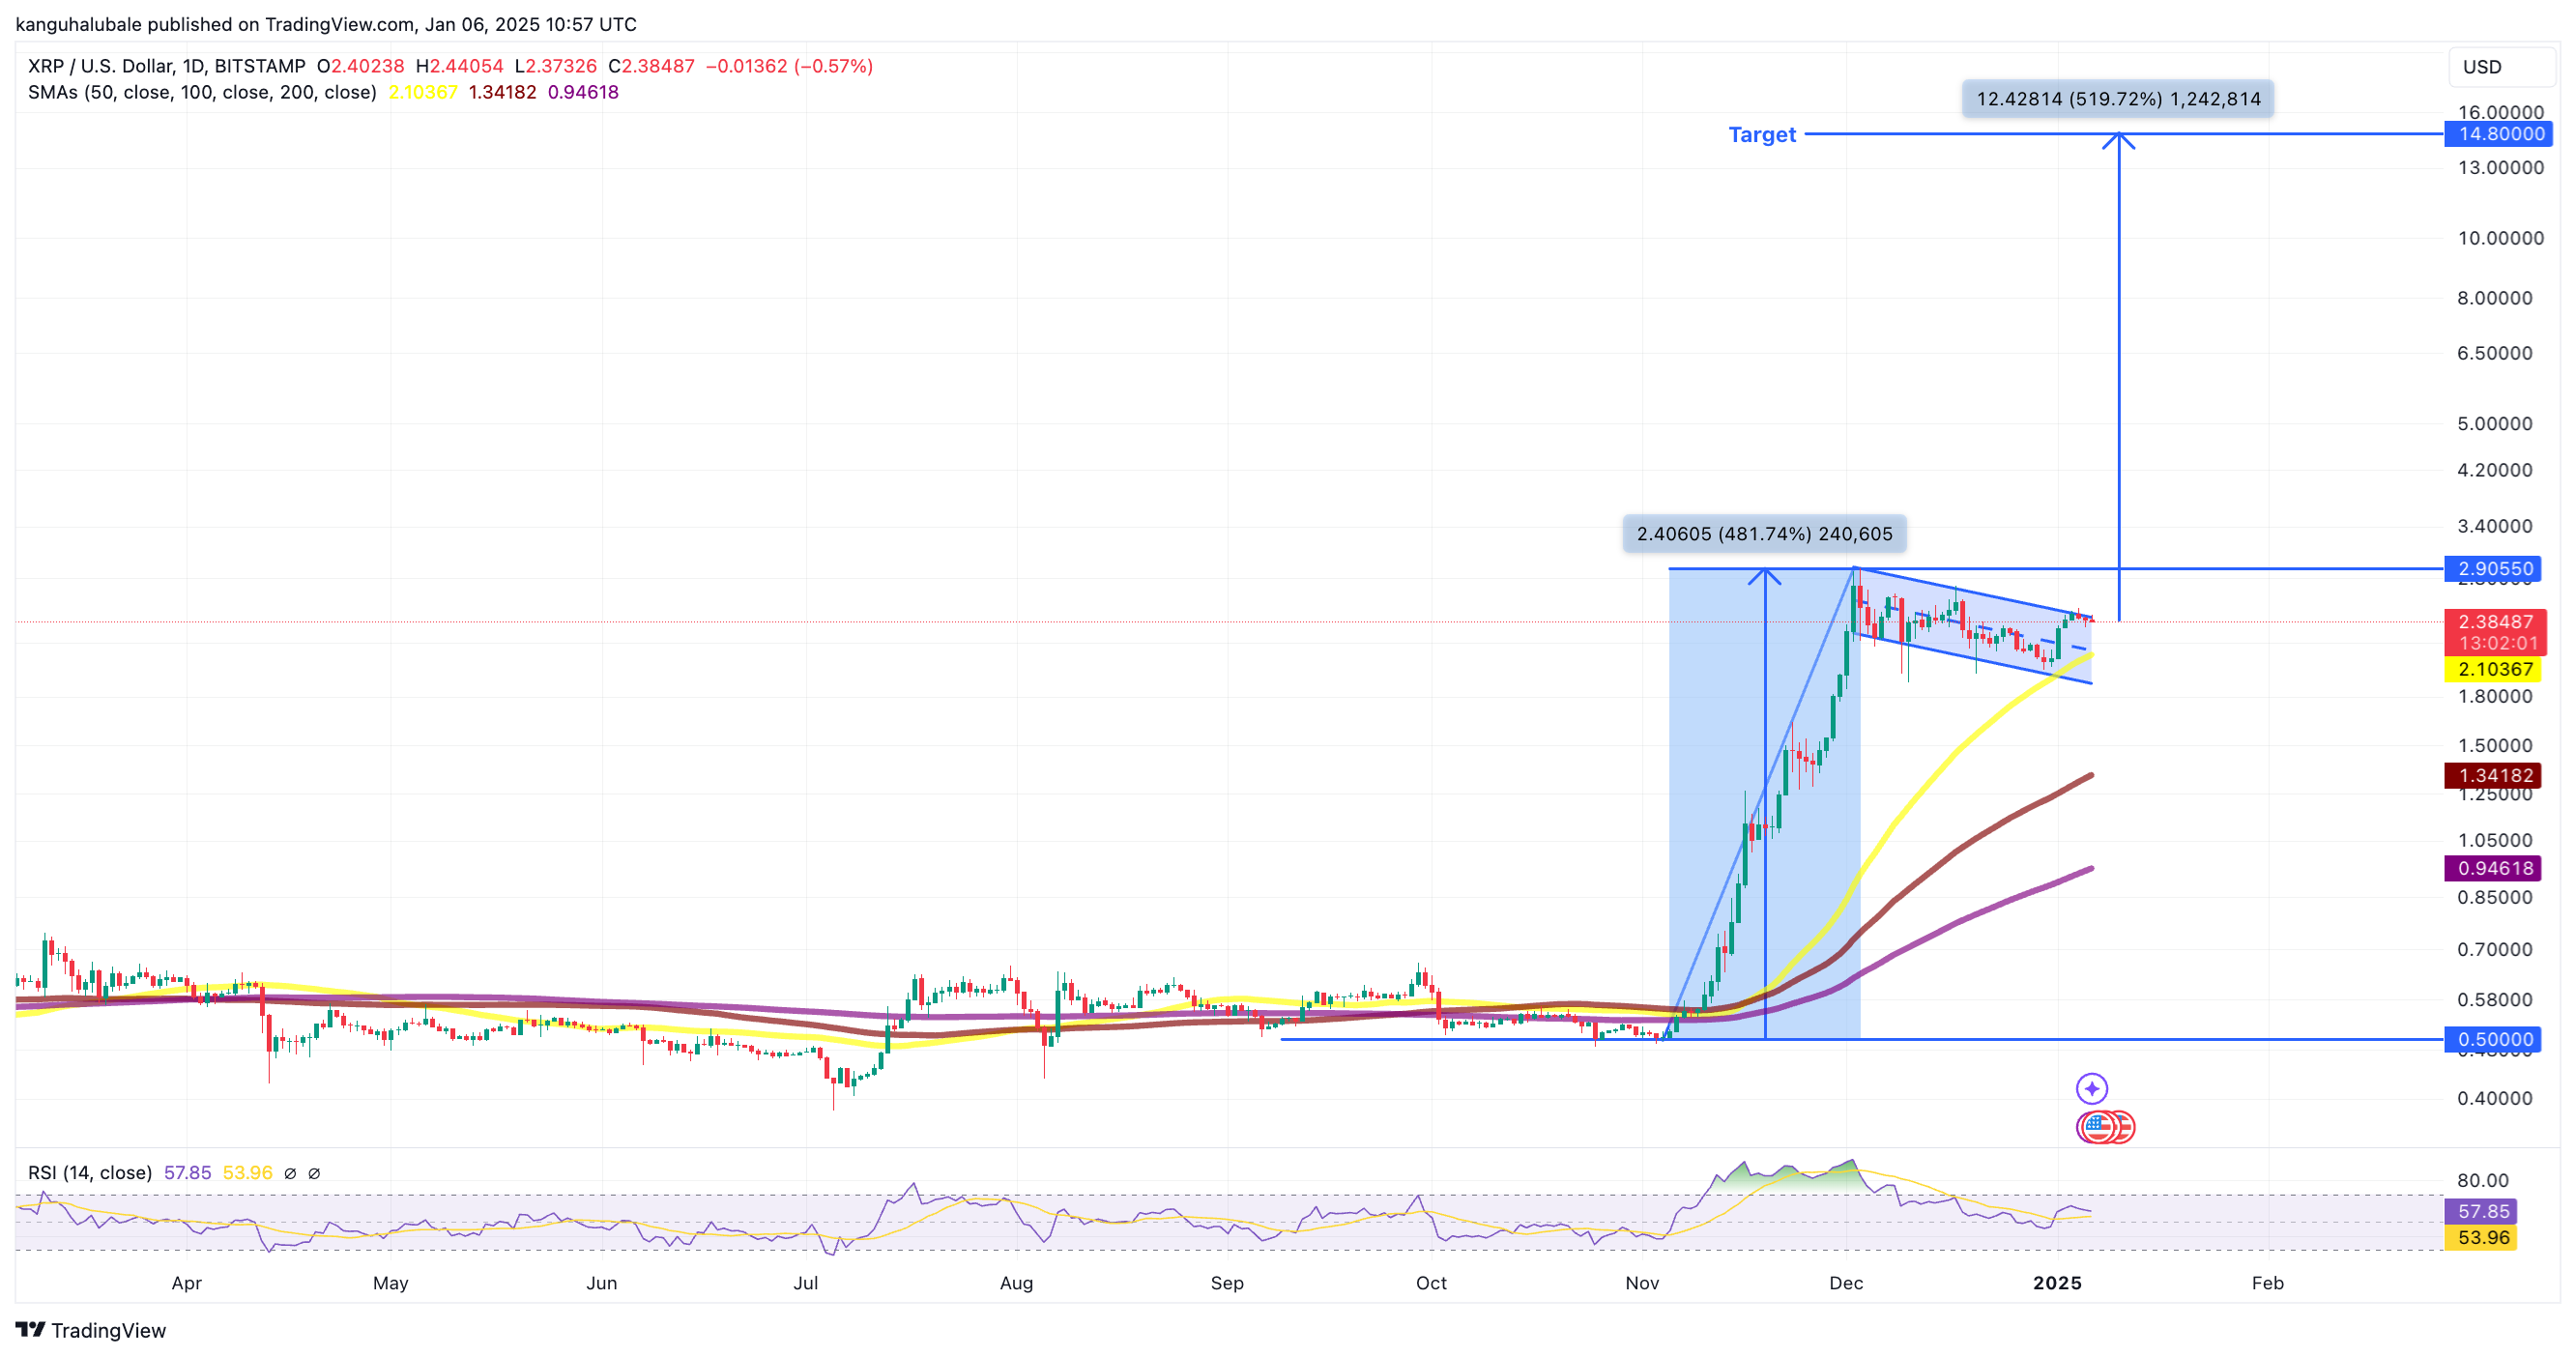
XRP/USD daily chart featuring bull flag pattern. Source: Cointelegraph/TradingView
Other bullish indicators that can be observed on the chart are the immediate support provided by the 50-day simple moving average at $2.10 and the relative strength index resetting just above the 50 mark.
Several analysts have also predicted a $15 XRP price target by 2025, citing market sentiment toward XRP’s adoption and partnership growth, fueled by a crypto-friendly Trump administration.
Using Fibonacci levels and Elliott Wave theory, popular crypto analyst Egrag Crypto shared an optimistic prediction, saying that XRP price can hit $15 by May 5, 2025.
Author

Cointelegraph Team
Cointelegraph
We are privileged enough to work with the best and brightest in Bitcoin.


