XRP, BNB and Solana brace for a bearish September
- XRP price fell over 8% in the past week, holding flat in the last 24 hours as sentiment turns bearish.
- BNB is nearly 6% below its all-time high, holding support at $850 on Monday.
- Solana erased nearly 3% of its value over the past week, with its daily outlook remaining bearish.
- September is typically bearish for Bitcoin; with BTC consolidating, most altcoins are expected to follow.

XRP, BNB and Solana prices have been in a decline the past seven days. Traders are concerned about the market-wide correction in crypto. The sentiment indicator called the Fear & Greed Index shows traders have turned “fearful,” a sign of a bearish outlook.
XRP price analysis
XRP is currently consolidating under the psychologically important $3 level. At the time of writing on Monday, XRP trades at $2.7630. The native token of the XRP Ledger is in a state of consolidation within a tight range between $3.3512 and $2.7014, marked as the red region in the XRP/USDT daily price chart.
Two key momentum indicators, the Relative Strength Index (RSI) and the Moving Average Convergence Divergence (MACD), support a bearish thesis. The RSI reads 39 and is sloping downward, and the red histogram bars under the neutral line on the MACD signal an underlying negative momentum in the XRP price trend.
Support at $2.60 and $2.35 are two key levels for XRP, and a 5.6% decline could send the altcoin to sweep liquidity at the support.
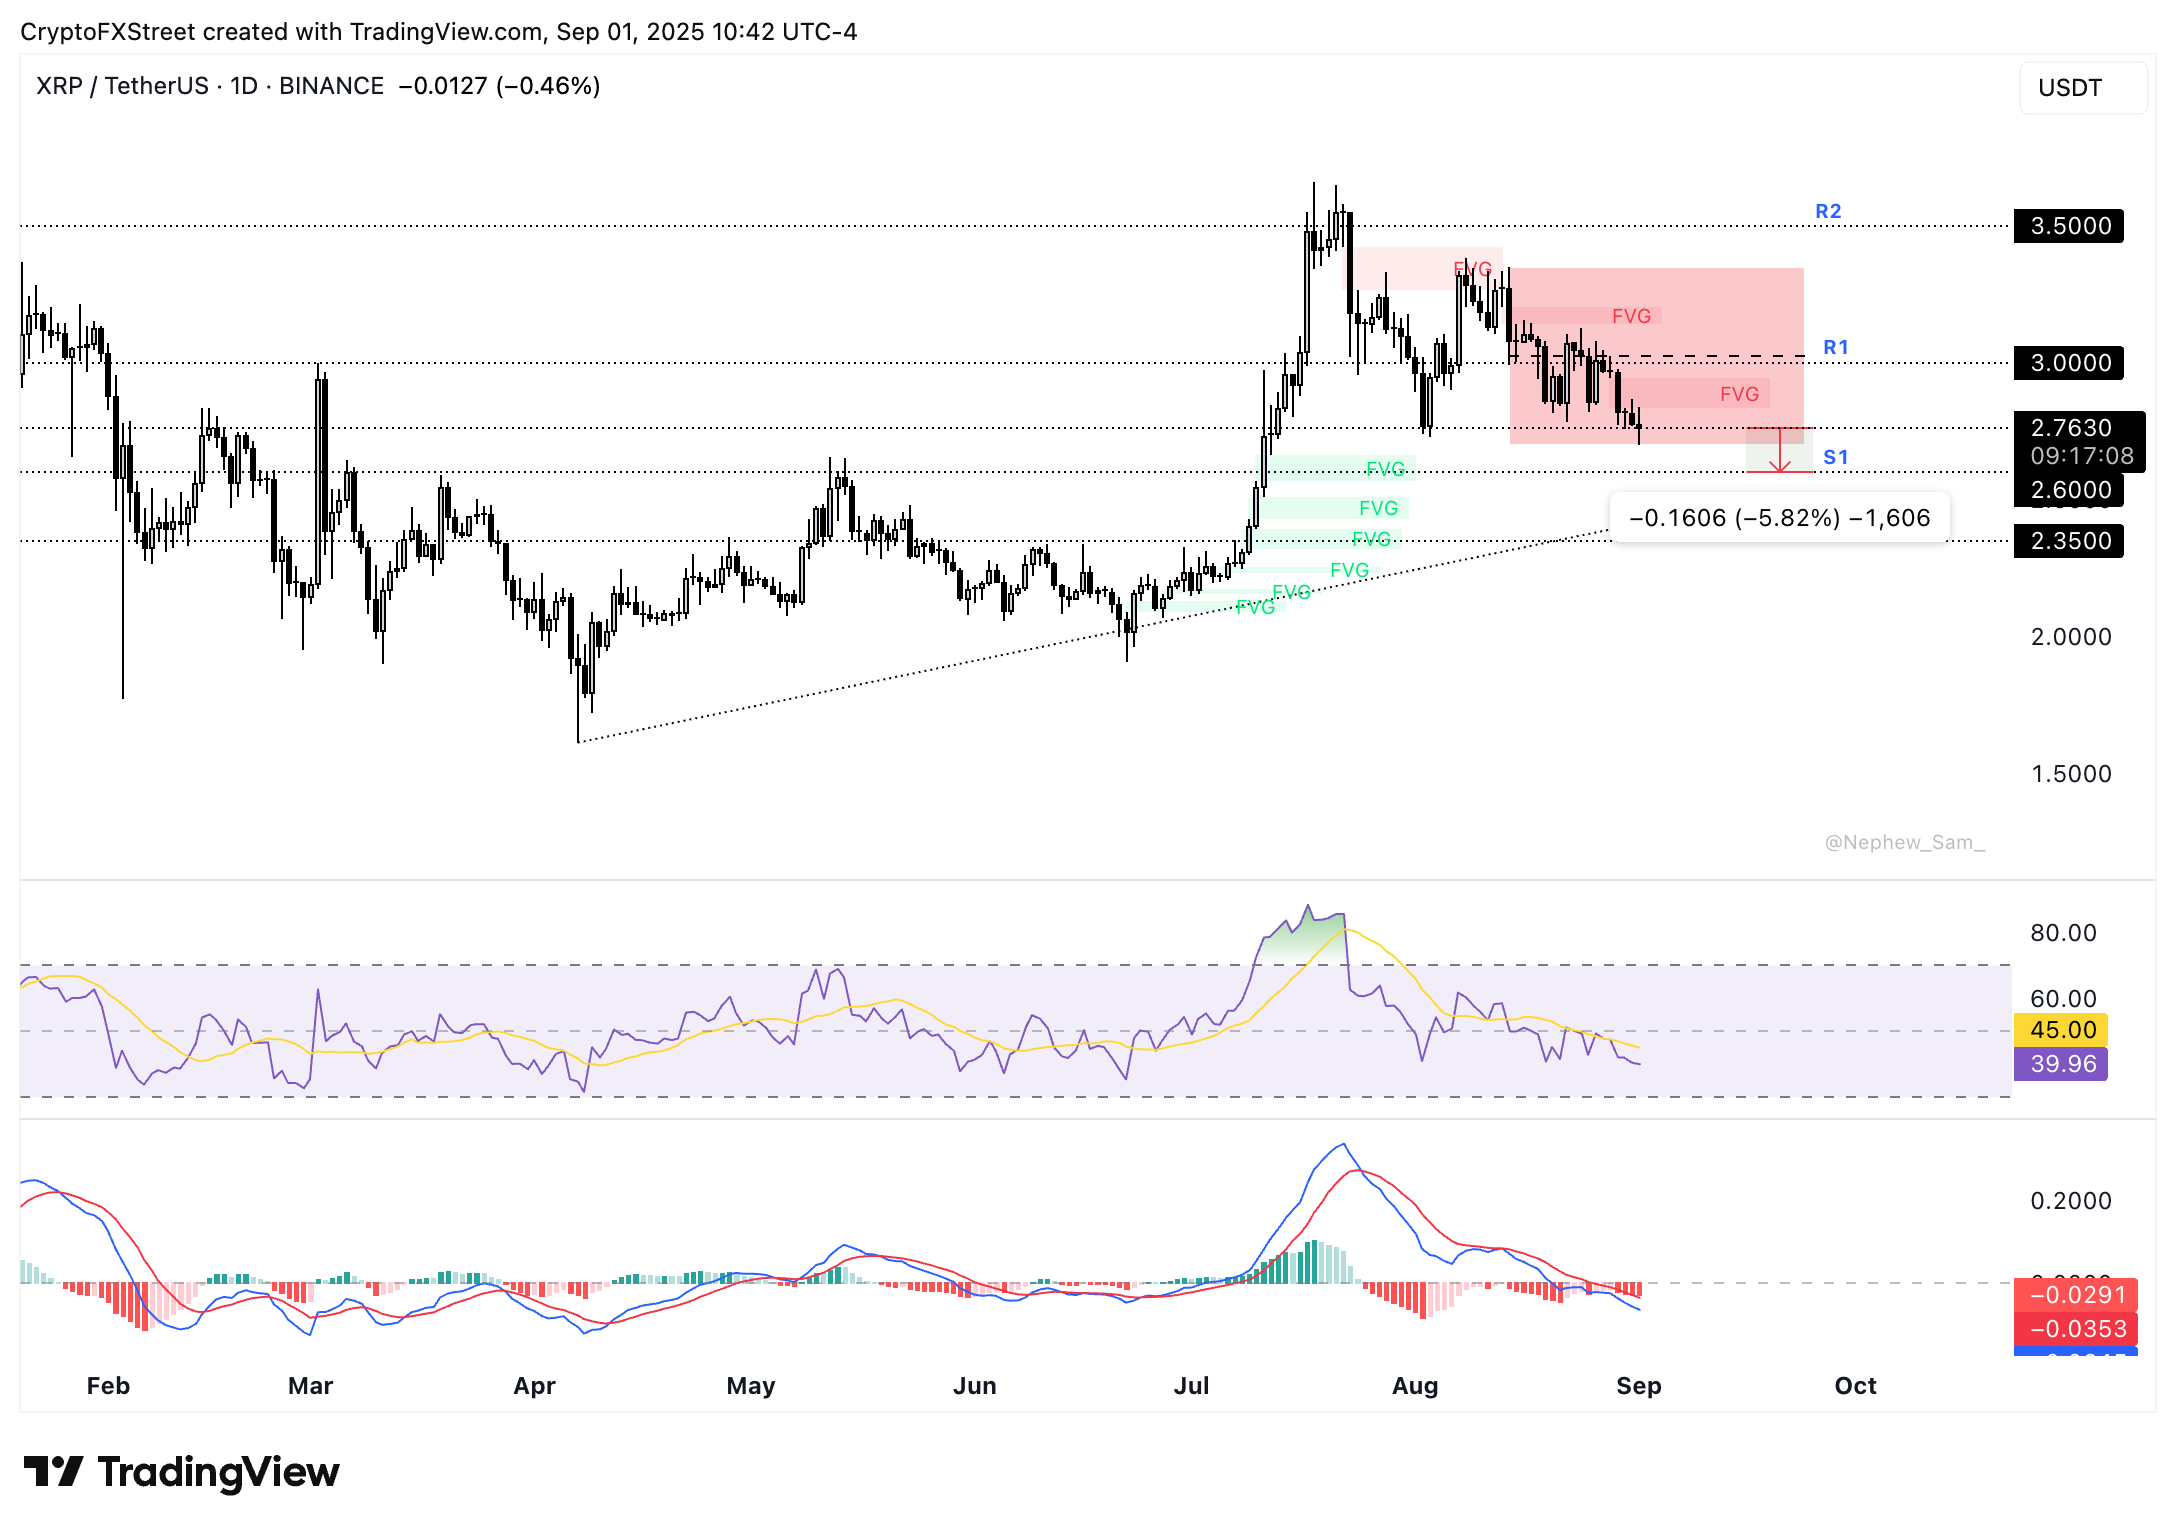
XRP/USDT daily price chart
A daily candlestick close above $3 would invalidate the bearish thesis.
BNB price analysis
BNB price slipped nearly 3% in the last seven days as the token is currently consolidating close to support at $850 on Monday. The native token of the exchange is in an upward trend and wiped its gains from late August where price hit a peak above $900, as seen in the BNB/USDT daily price chart.
BNB could find support at S1 and S2, at $820 and $785, the two key levels for the token.
The RSI reads 53, and the MACD shows an underlying negative momentum in BNB price trend.
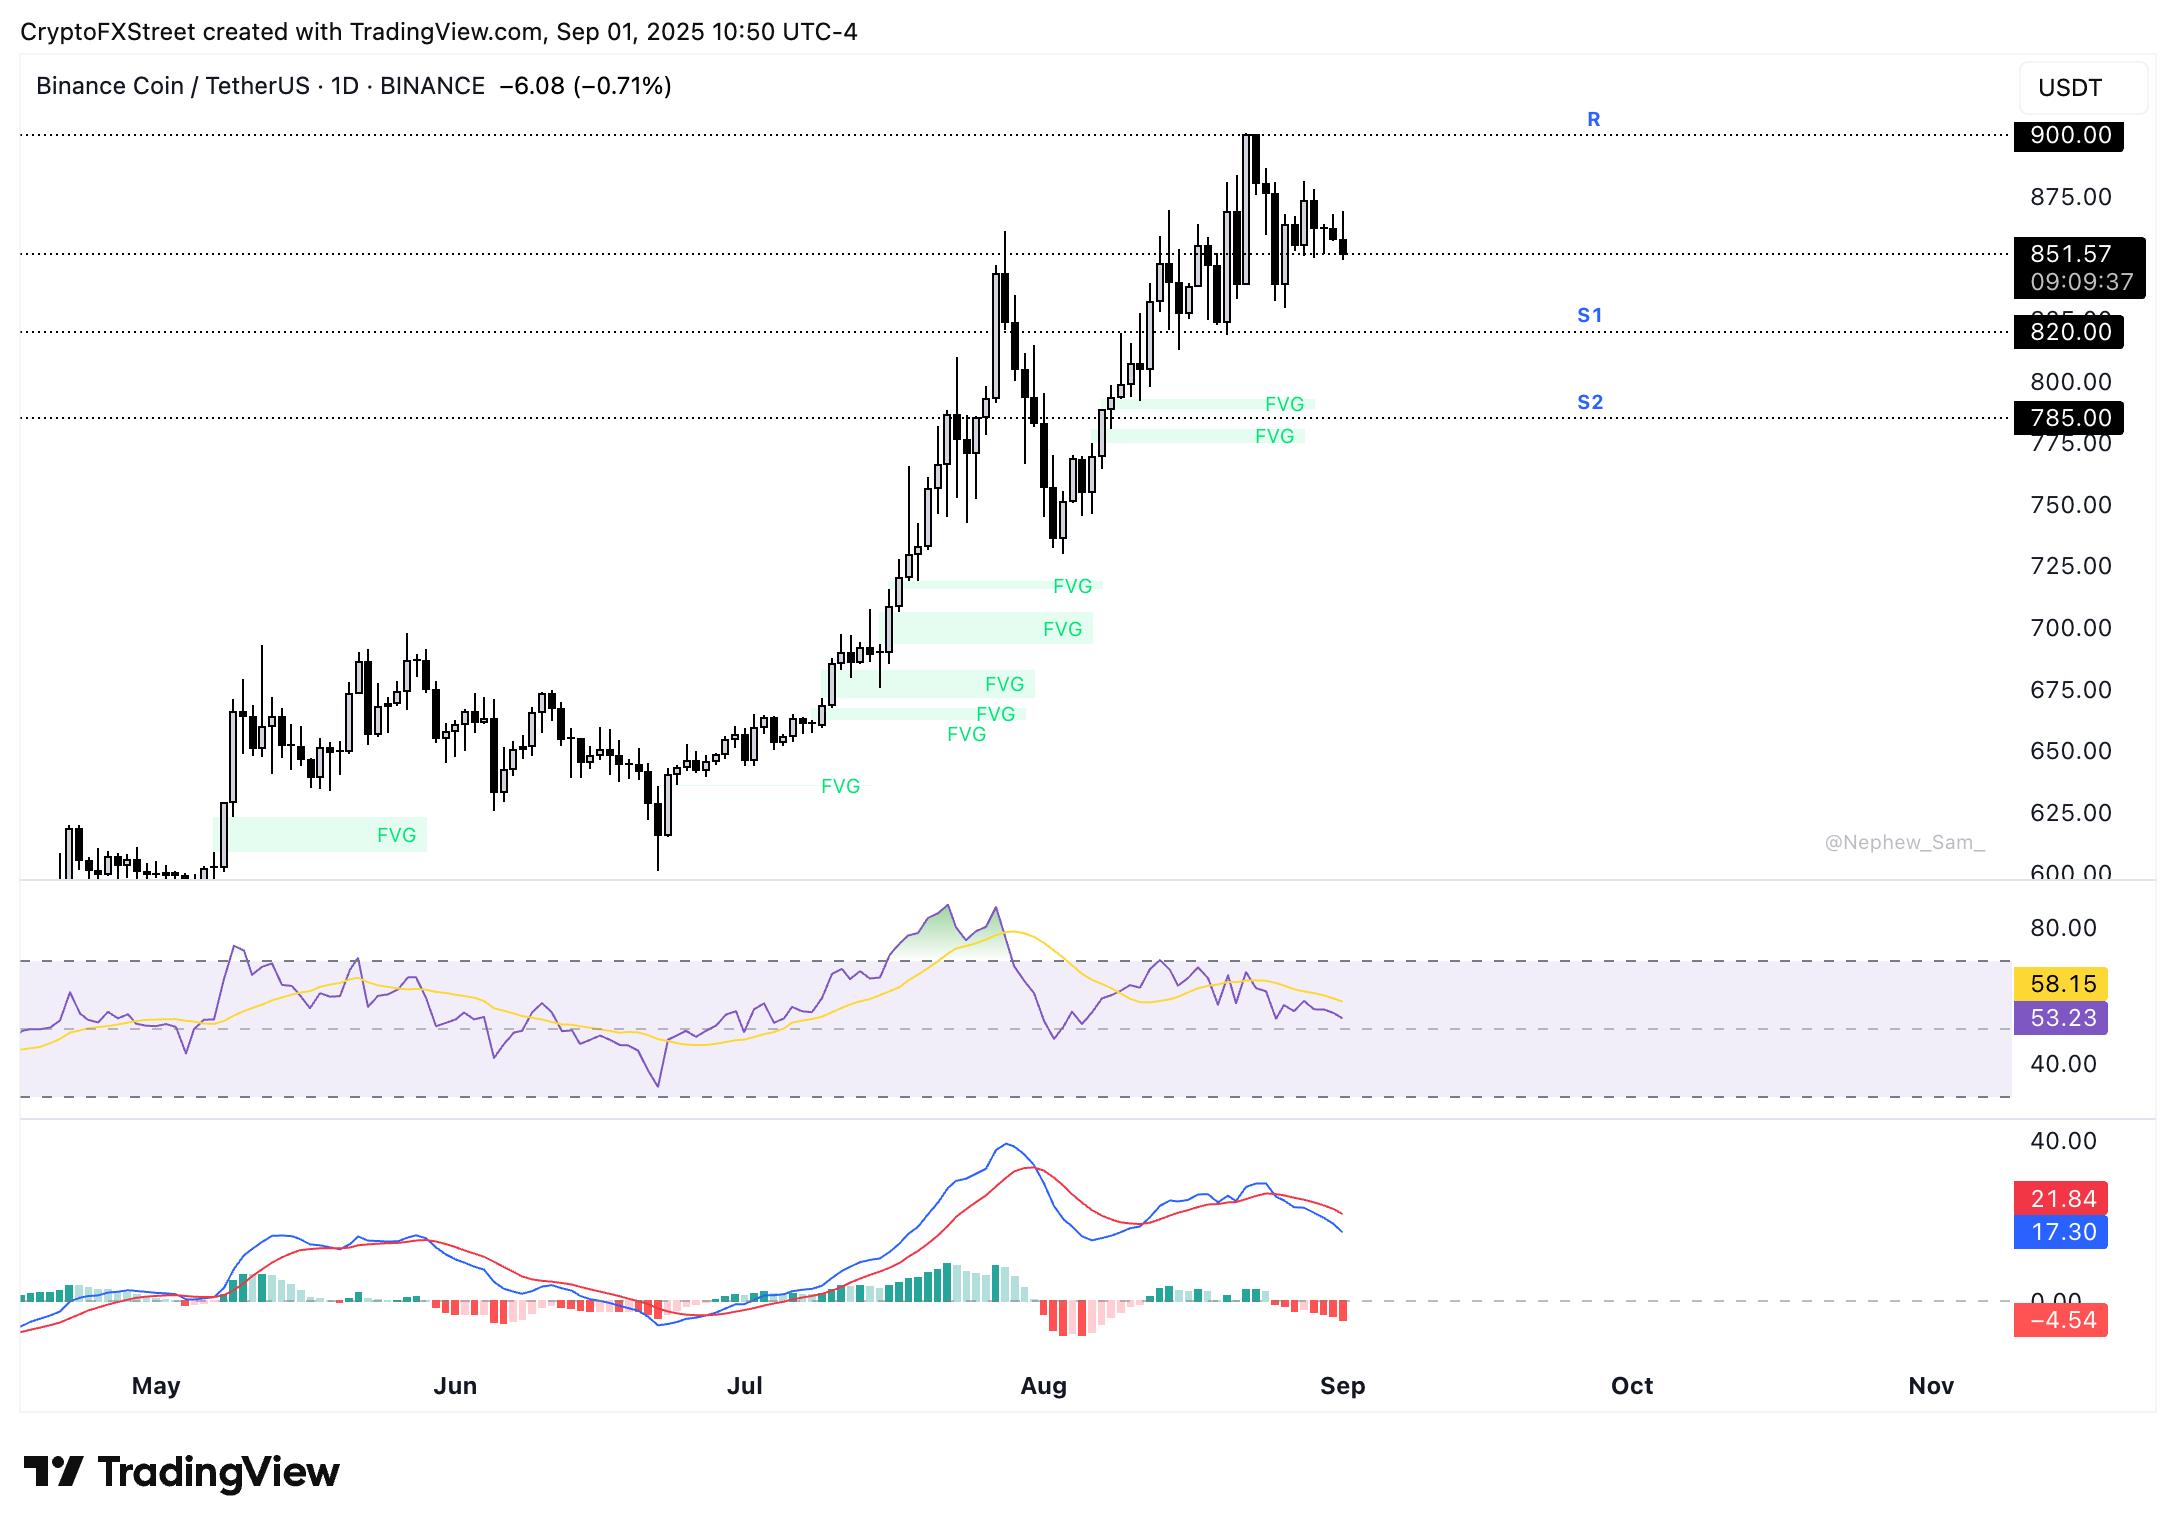
BNB/USDT daily price chart
If BNB sweeps liquidity at S1 and attempts a recovery, the bearish thesis is likely to be invalidated. BNB could test resistance at the $900 level in its climb toward a new all-time high.
Solana price analysis
Solana wiped out 3% of its value in the last seven days, similar to BNB. SOL trades at $200.80, holding steady above the support at $200. Two key resistances for Solana are price levels previously respected as resistance at $228.24 and $250, marked by R1 and R2, respectively.
SOL hit an all-time high at $295.83 on January 19 and a sustained upward trend could push Solana to re-test this level.
The MACD supports a bullish thesis, while the RSI is neutral. The RSI reads 54, slightly above neutral. However, the current consolidation close to $200 has raised concerns of a correction.
The August 20 low of $126 and the August 26 low of $185 are support levels for Solana.
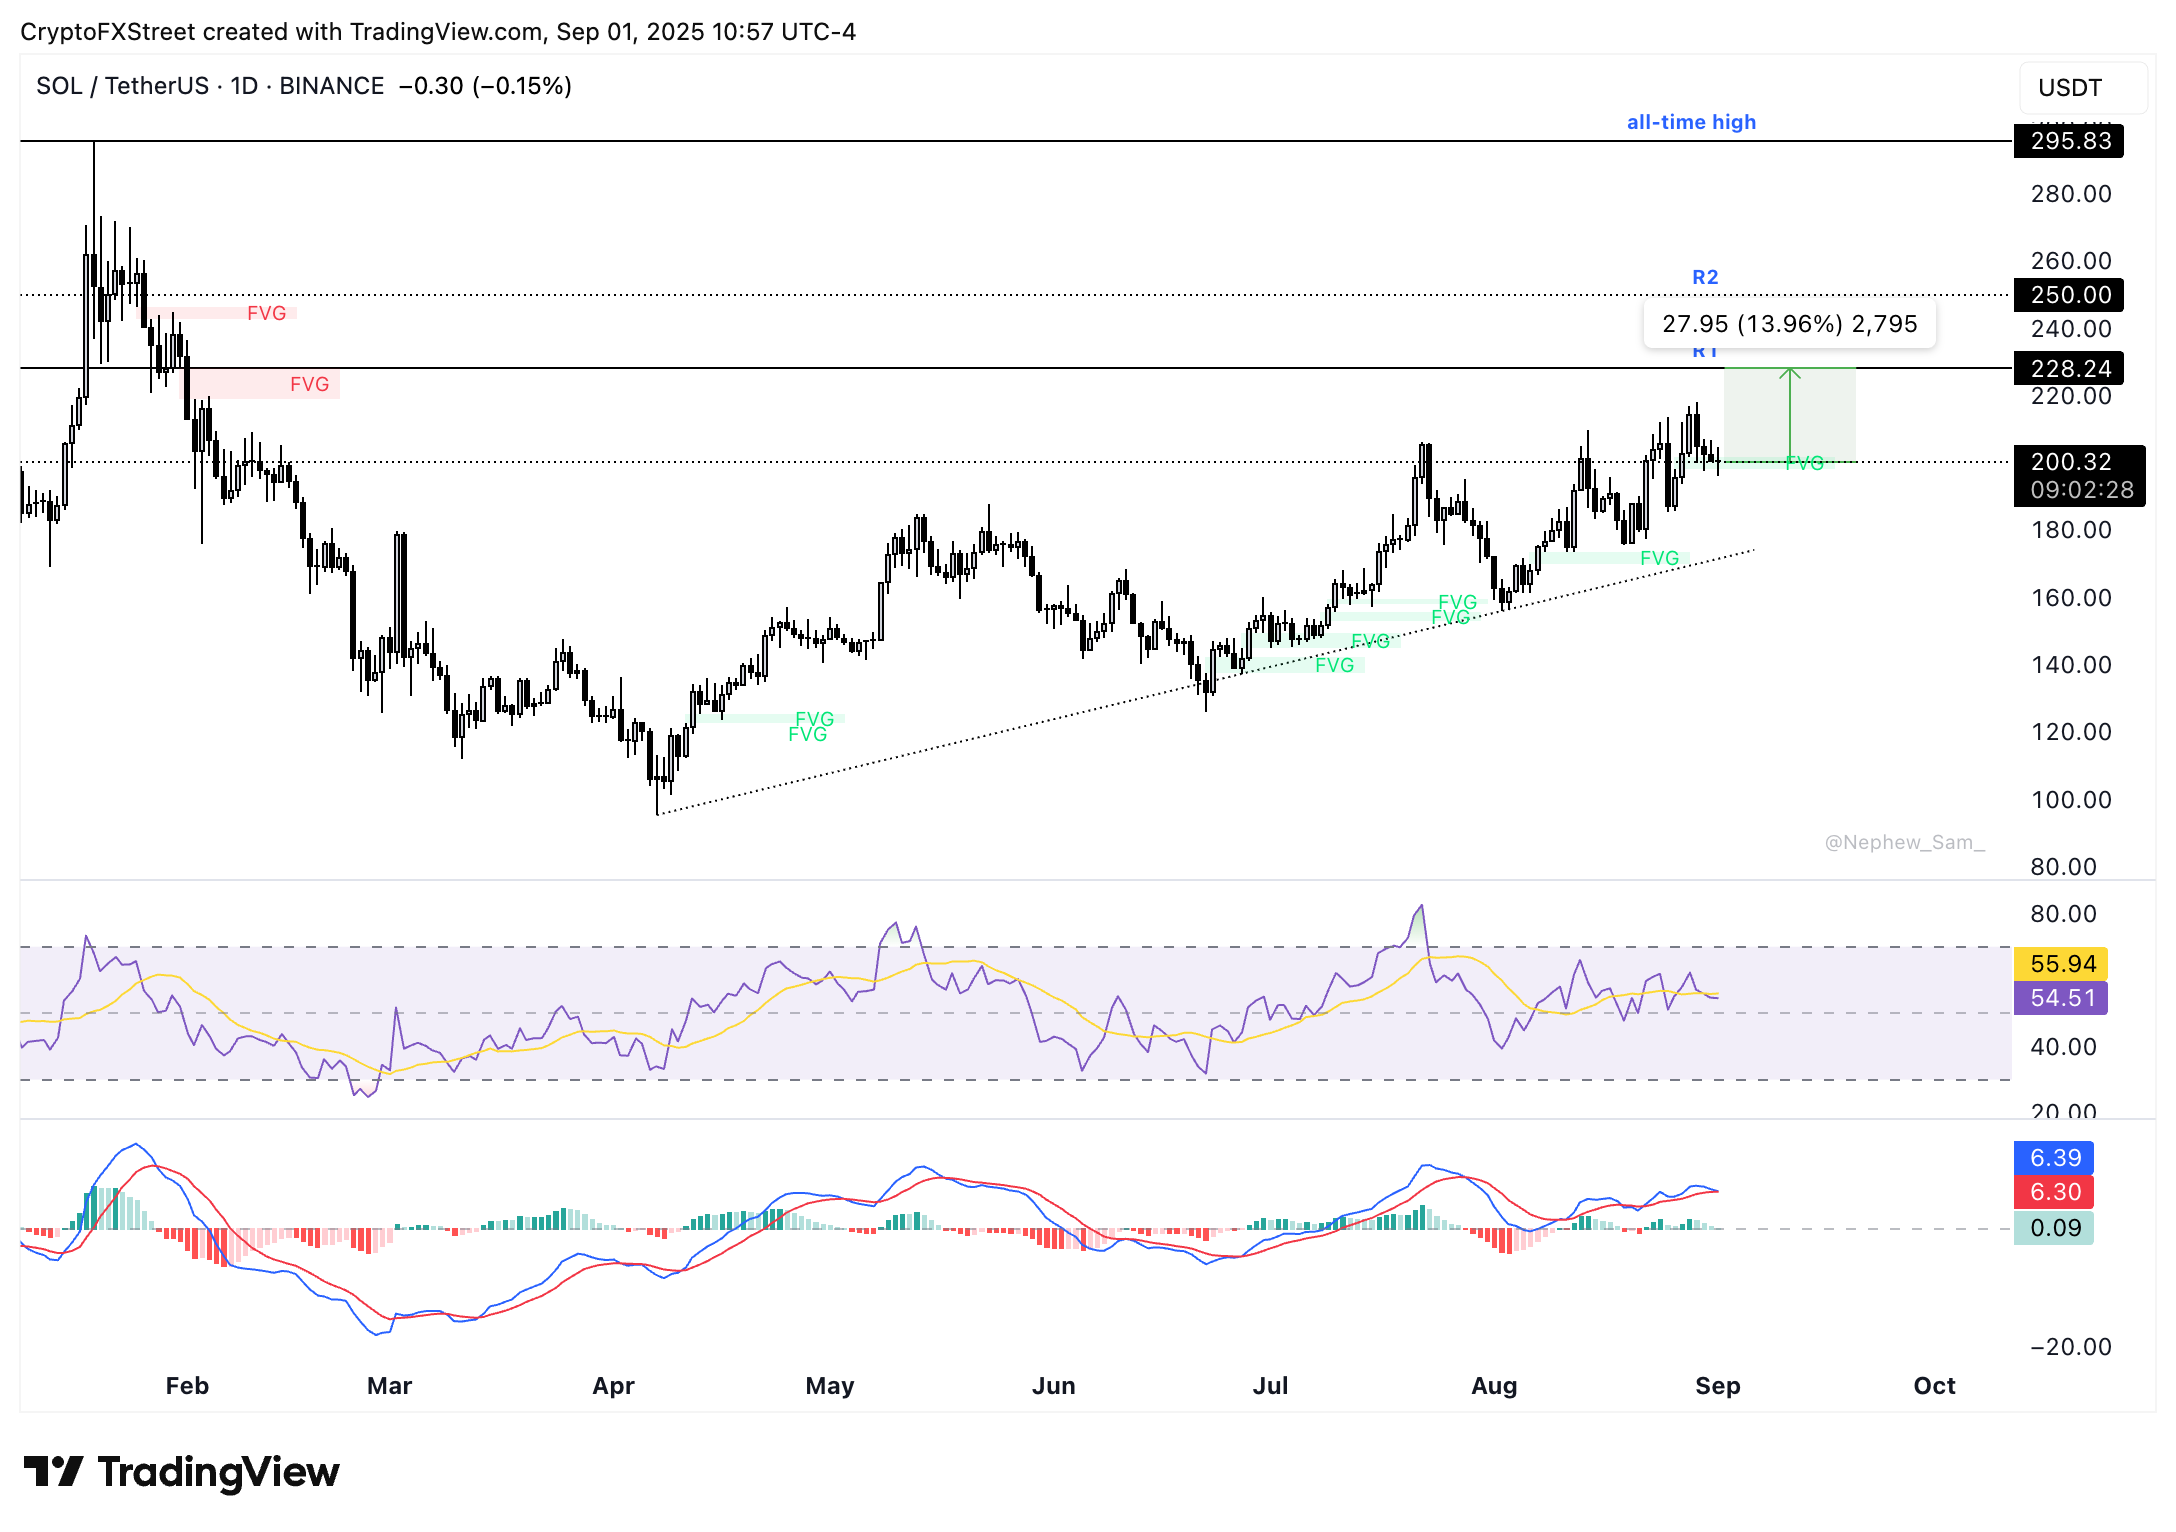
SOL/USDT daily price chart
A daily candlestick close under the $200 could invalidate the bullish thesis and open doors to further correction in Solana.
Author

Ekta Mourya
FXStreet
Ekta Mourya has extensive experience in fundamental and on-chain analysis, particularly focused on impact of macroeconomics and central bank policies on cryptocurrencies.


