- XLM price has been trading above the 26-EMA on the 12-hour chart for the past three weeks.
- Once again, the bulls have defended this point and aim for a significant rebound.
- A key indicator has presented a sell signal on the daily chart, increasing selling pressure.
Stellar climbed above the 26-EMA on the 12-hour chart on January 28 and hasn’t lost the support level since then. In the past 24 hours, the entire cryptocurrency market suffered a massive sell-off, but XLM bulls managed to hold the 26-EMA once again, with a significant 27% rebound.
XLM price on its way to $0.70 again as it faces no barriers
On the 12-hour chart, every time XLM price touched the 26-EMA or was close to it, it had a significant rebound in the next 24 hours. Once again, XLM touched the 26-EMA but managed to rebound strongly.
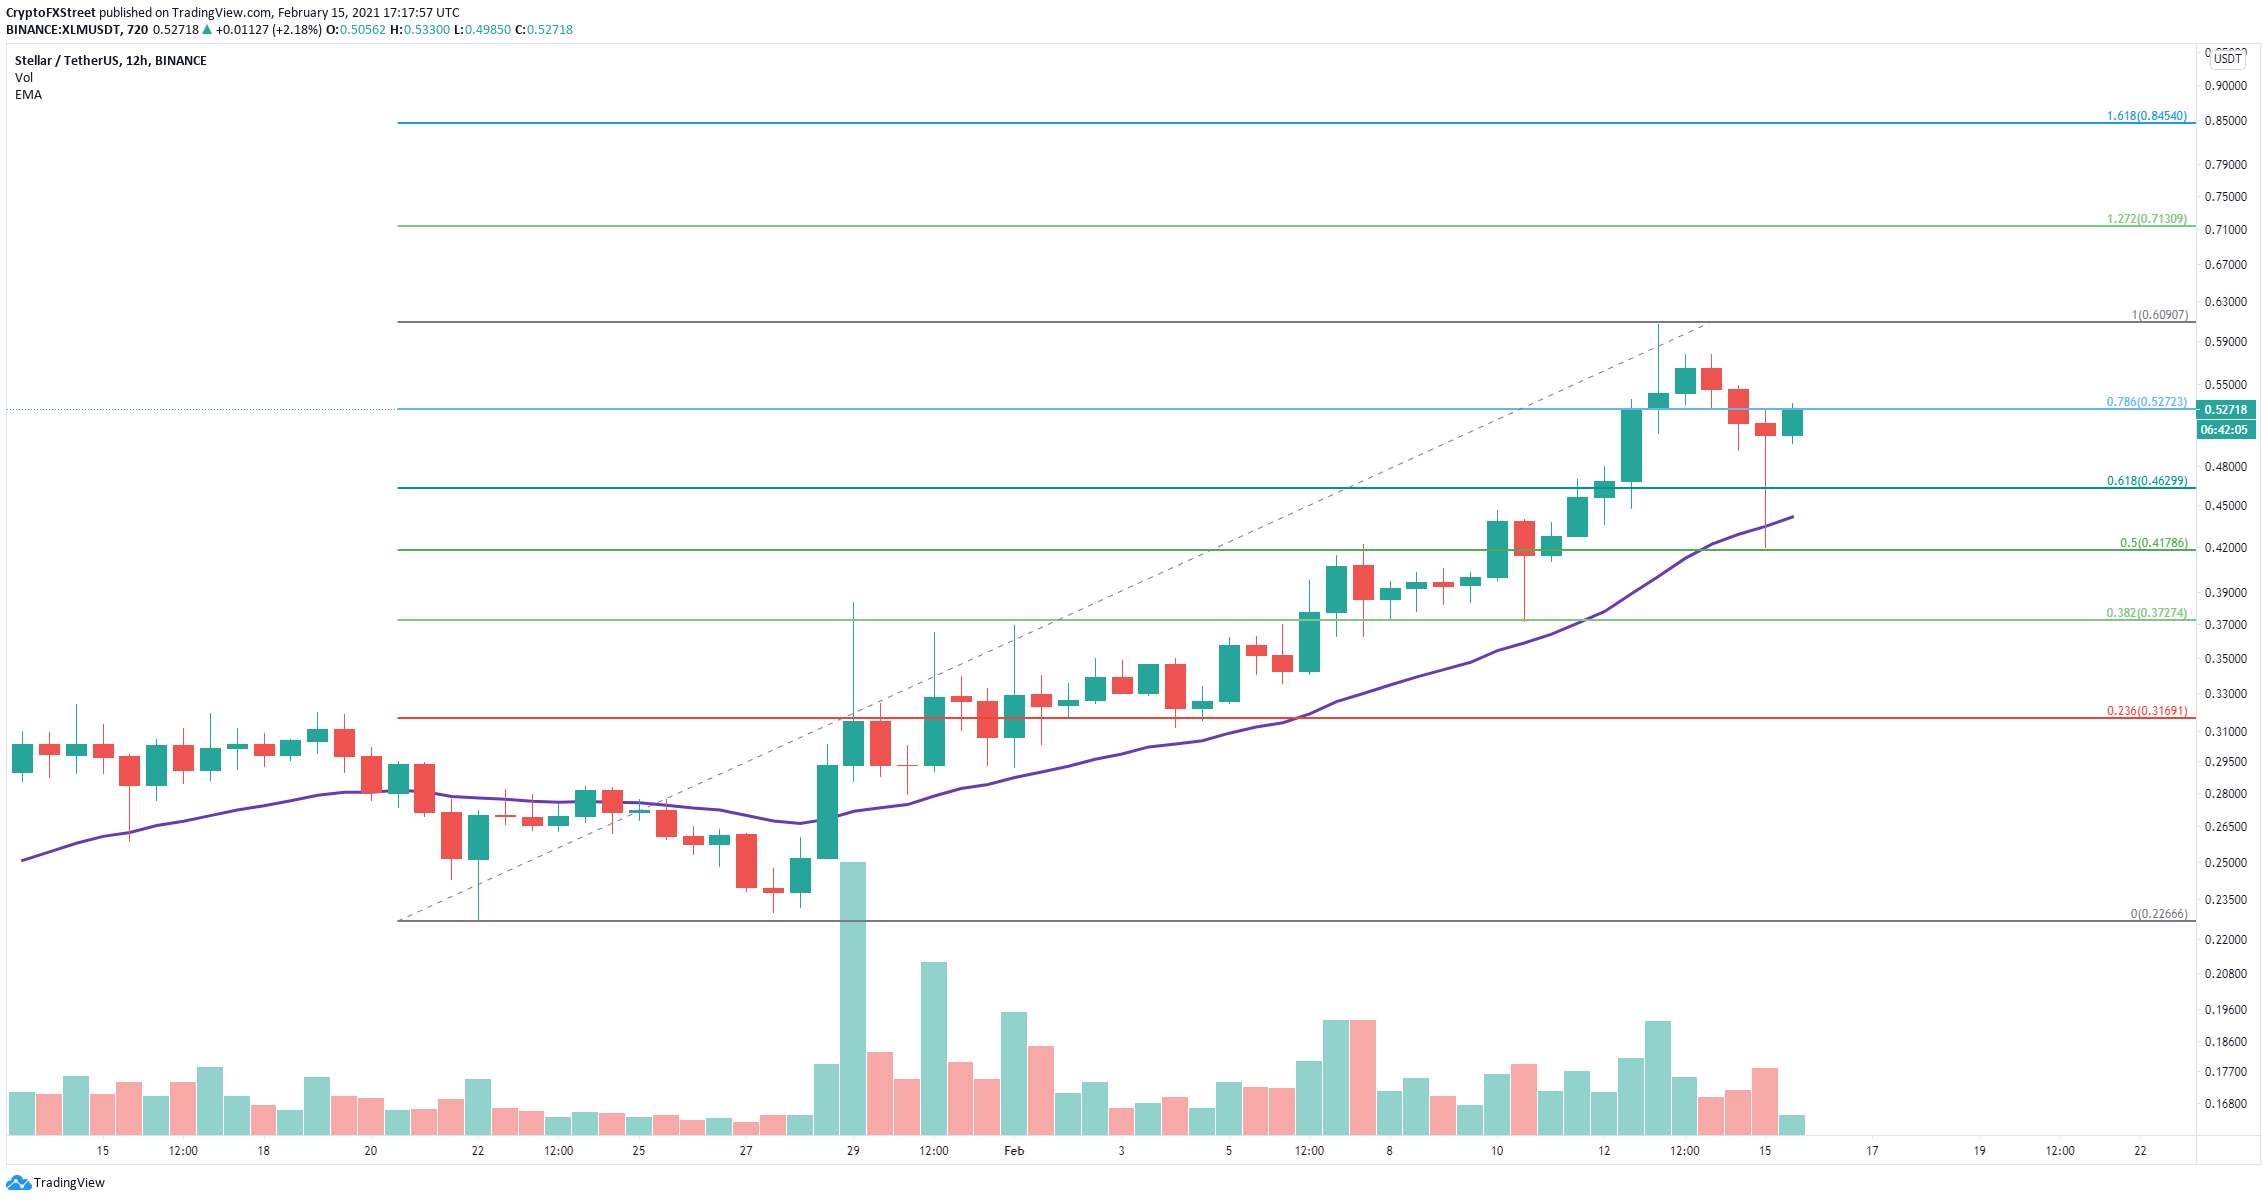
XLM/USD 12-hour chart
The only significant resistance level is the previous high of $0.606. A breakout above this point can quickly push XLM price up to $0.71 at the 127.2% Fibonacci level. In the long-term, XLM can even climb towards $0.845 at the 161.8% fib level.
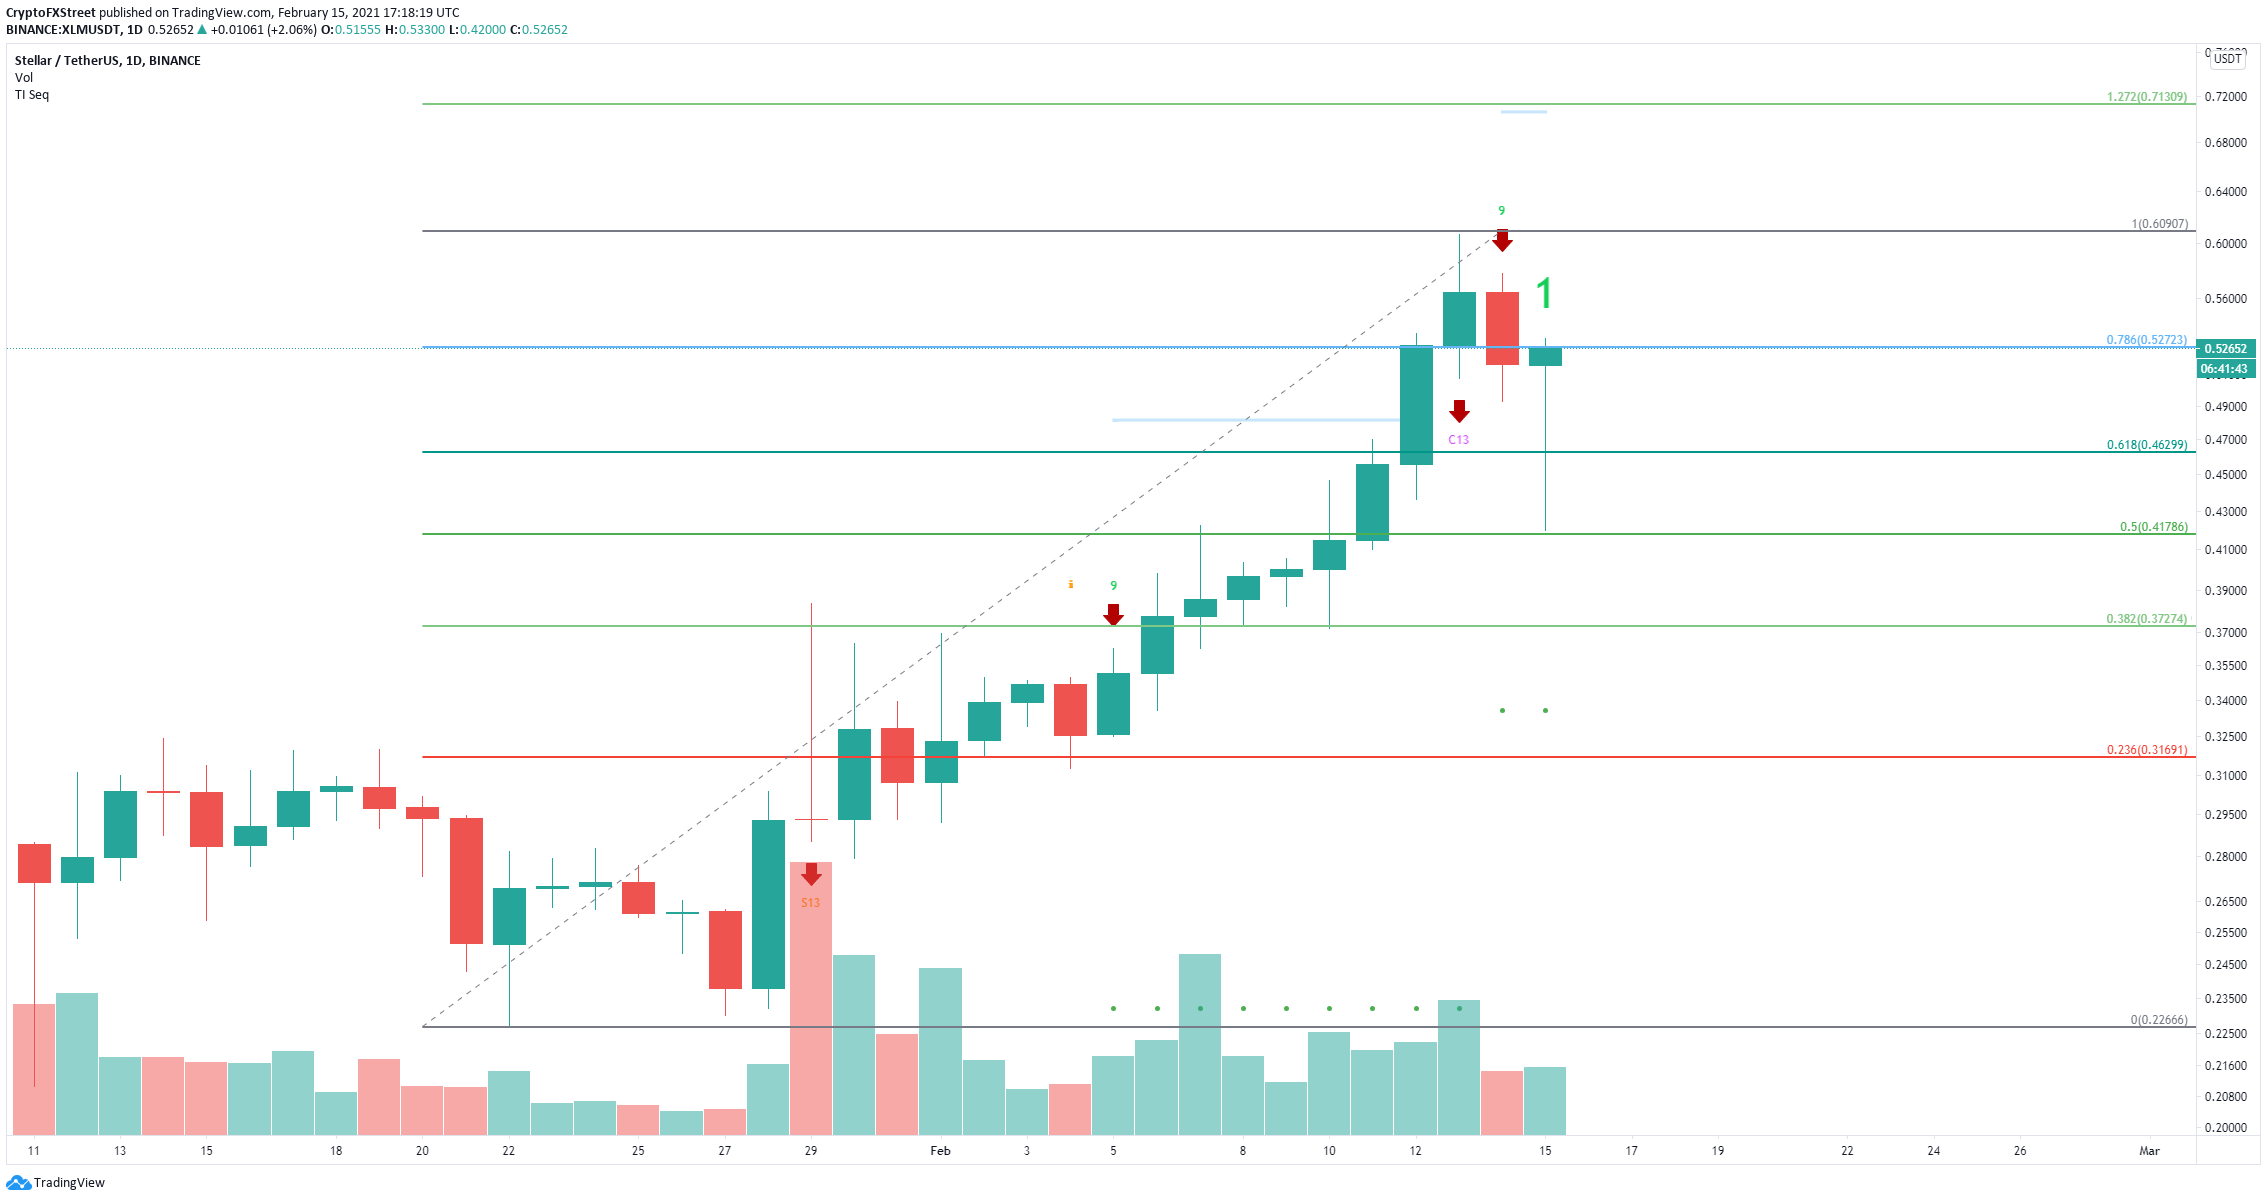
XLM/USD daily chart
However, on the daily chart, the TD Sequential indicator has just presented a sell signal that had a lot of continuation with the most recent sell-off. XLM price touched $0.462, the 61.8% level, and $0.41, the 50% fib level. Both of these two levels can be revisited again if the bearish momentum continues.
Note: All information on this page is subject to change. The use of this website constitutes acceptance of our user agreement. Please read our privacy policy and legal disclaimer. Opinions expressed at FXstreet.com are those of the individual authors and do not necessarily represent the opinion of FXstreet.com or its management. Risk Disclosure: Trading foreign exchange on margin carries a high level of risk, and may not be suitable for all investors. The high degree of leverage can work against you as well as for you. Before deciding to invest in foreign exchange you should carefully consider your investment objectives, level of experience, and risk appetite. The possibility exists that you could sustain a loss of some or all of your initial investment and therefore you should not invest money that you cannot afford to lose. You should be aware of all the risks associated with foreign exchange trading, and seek advice from an independent financial advisor if you have any doubts.
Recommended Content
Editors’ Picks
Why crypto may see a recovery right before or shortly after Bitcoin halving
Cryptocurrency market is bleeding, with Bitcoin price leading altcoins south in a broader market crash. The elevated risk levels have bulls sitting on their hands, but analysts from Santiment say this bleed may only be cauterized right before or shortly after the halving.
Manta Network price braces for volatility as $44 million worth of MANTA is due to flood markets
Manta Network (MANTA) price was not spared from the broader market crash instigated by a weakness in the Bitcoin (BTC) market. While analysts call a bottoming out in the BTC price, the Web3 modular ecosystem token could suffer further impact.
Bitcoin price uptrend to continue post-halving, Bernstein report says as traders remain in disarray
Bitcoin is dropping amid elevated risk levels in the market. It comes as traders count hours to the much-anticipated halving event. Amid the market lull, experts say we may not see a rally until after the halving.
OMNI post nearly 50% loss after airdrop and exchange listing
Omni network (OMNI) lost nearly 50% of its value on Wednesday after investors dumped the token following its listing on top crypto exchanges. A potential reason for the crash may be due to the wider crypto market slump.
Bitcoin: BTC’s rangebound movement leaves traders confused
Bitcoin (BTC) price has been hovering around the $70,000 psychological level for a few weeks, resulting in a rangebound movement. This development could lead to a massive liquidation on either side before a directional move is established.