XLM Price Prediction: Stellar technicals converge for a 30% decline
- XLM price activated a head-and-shoulders top pattern on April 22.
- Weekly MACD readying to trigger sell signal.
- Upside potential blocked by the 361.8% Fibonacci extension of 2019-2020 bear market.

XLM price is attempting to recover the 43% decline, but the weekly technicals converge with a bearish bias, recommending a patient approach.
XLM price chart shows little room for failures
At the April 23 low, Stellar was down over 40%. The daily Relative Strength Index (RSI) reached a similar oversold reading as the December 2020 low and far more oversold than the January and February lows.
Ever since, the Stellar price action has been reluctant and supported by below-average volume, suggesting a lack of conviction, particularly compared to what has transpired with other cryptocurrencies.
From a weekly perspective, the technical mix reveals a digital token teetering on the edge of another major sell-off. For one, the bearish momentum divergence of the weekly RSI at the price highs was a cautionary flag for the bullish speculators as it marked a lack of impulsiveness accompanying the rally.
The inability of Stellar to hold weekly gains above the 361.8% extension of the 2019-2020 bear market and subsequent resistance produces another challenge for the altcoin. Reinforcement for the bearish outlook is that the weekly Moving Average Convergence Divergence (MACD) indicator is one price drop away from triggering a macro sell signal. It would be the first time since September 2020.
The downside target is the rising trend line beginning in November 2020, and it currently sits at $0.343, representing a decline of almost 30% from the price at the time of writing.
Some support will materialize at the 10-week simple moving average (SMA) at $0.447 and possibly at the 100-day SMA at $0.427. A failure to hold the rising trend line will knock Stellar down to the February low of $0.314.
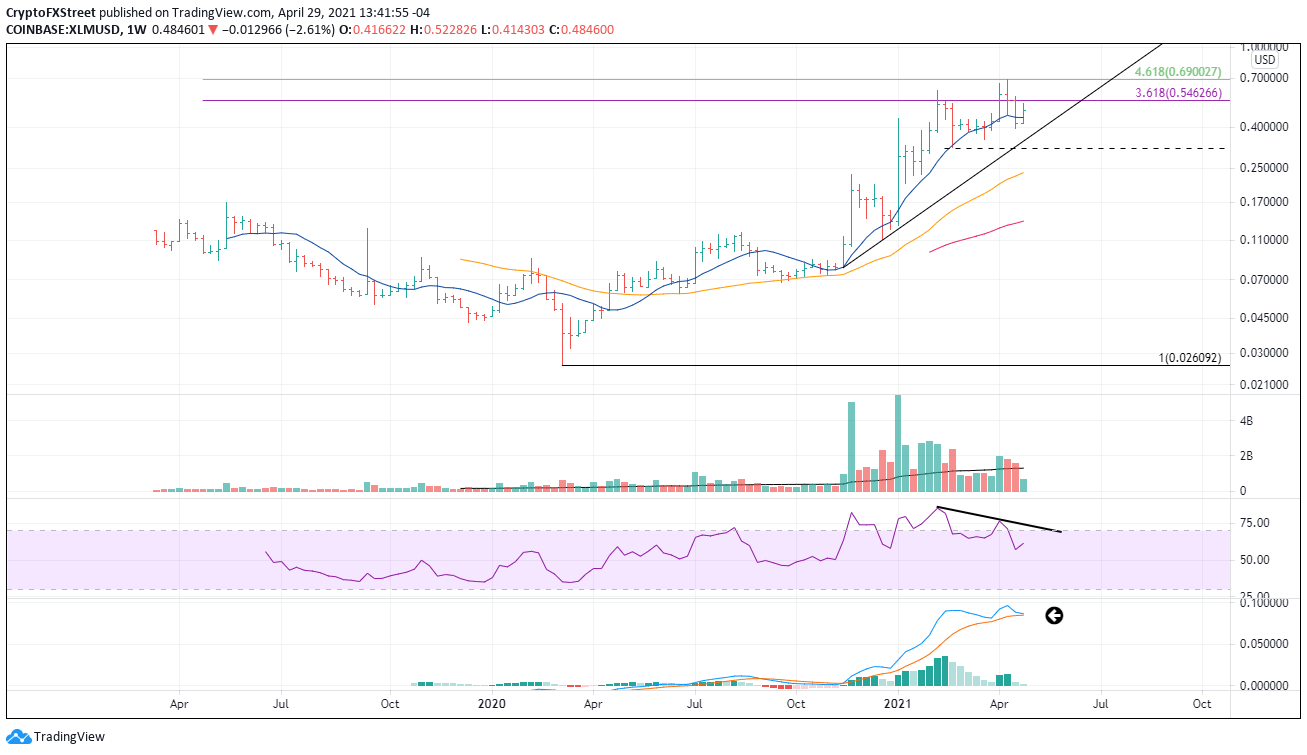
XLM/USD weekly chart
On a 4-hour chart, a head-and-shoulders bottom may be unfolding, raising the potential for a bull trap before the Stellar price evacuation.
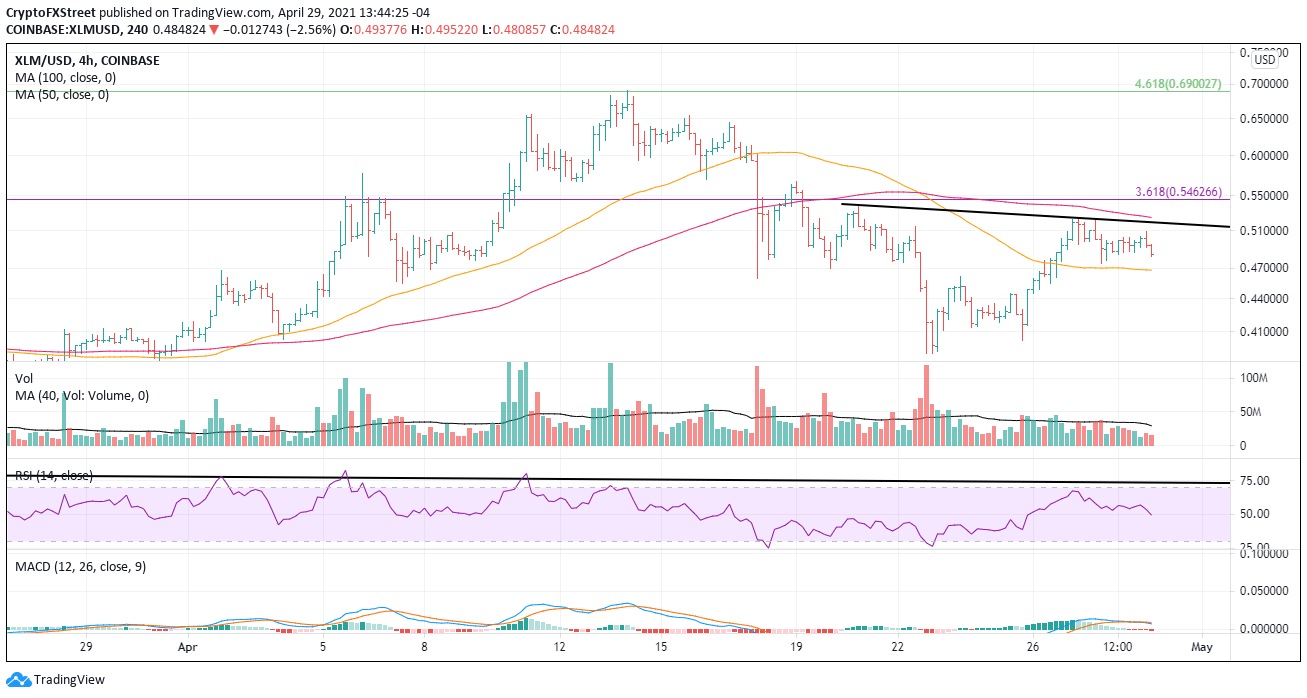
XLM/USD 4-hour chart
If the head-and-shoulders bottom evolves into more than a trap, the first target is the April high at $0.690, slightly above the 461.8% extension of the 2019-2020 bear market. At that point, market speculators could evaluate the potential for higher prices.
Author

Sheldon McIntyre, CMT
Independent Analyst
Sheldon has 24 years of investment experience holding various positions in companies based in the United States and Chile. His core competencies include BRIC and G-10 equity markets, swing and position trading and technical analysis.


