XLM Price Forecast: Stellar buy signal fades, at risk of 35% decline
- XLM price releases from symmetrical triangle, but channel resistance halts the rally before it starts.
- Two bullish engulfing 12-hour candlesticks do not achieve the anticipated impact.
- 200-day simple moving average (SMA) remains critical support for Stellar in the short term.

XLM price is trending higher, but the channel’s lower trend line resistance combined with the weakness of the new rally leaves Stellar exposed to a sizeable decline if the market environment shifts negative.
XLM price struggles to create a new investment opportunity
On May 19, XLM price sliced through the 50-day SMA, the channel’s lower trend line and the 200-day SMA, removing the weakest of holders and biggest pockets of anxiety. The result was a 50% rebound for Stellar and a close above the channel’s lower trend line.
The moment of relief proved short-lived as XLM price plummeted below the May 19 low, evacuating the investors that bought the dip and effectively preparing Stellar to begin defining an actionable bottom.
Since May 20, XLM price had been forming a symmetrical triangle that resolved to the upside. The breakout has continued, including a bullish engulfing 12-hour candlestick on June 1, but the rare pattern could not overcome the channel’s lower trend line and closed with a long wick. It was the second bullish engulfing 12-hour candlestick since May 30.
For a bullish engulfing pattern to form, the cryptocurrency needs to open at a lower price than the previous bar and close higher than the open of the last bar. It represents a day in which the bears controlled the stock price in early trading only to have bulls decisively take over by the end of the day. Bullish engulfing candlesticks are more powerful if they follow a bearish trend.
The size of the upper wick of the bullish engulfing candlestick determines the probability that the next day will continue the positive price action. The longer the wick, the lower the value of the pattern.
The measured move target of the Stellar symmetrical triangle is $0.591, representing a 47% gain from the breakout price of $0.403. XLM price bulls face a tough challenge to reach the target beginning with the channel’s lower trend line at $0.450. The next resistance is the intersection of the 38.2% Fibonacci extension at $0.474 with the 200 twelve-hour SMA at $0.478.
Further resistance emerges at the 50 twelve-hour SMA at $0.519, quickly followed by the 50% retracement at $0.536. If investors are successful, Stellar should reach the measured move target at $0.591, which sits very close to the 61.8% retracement level at $0.597.
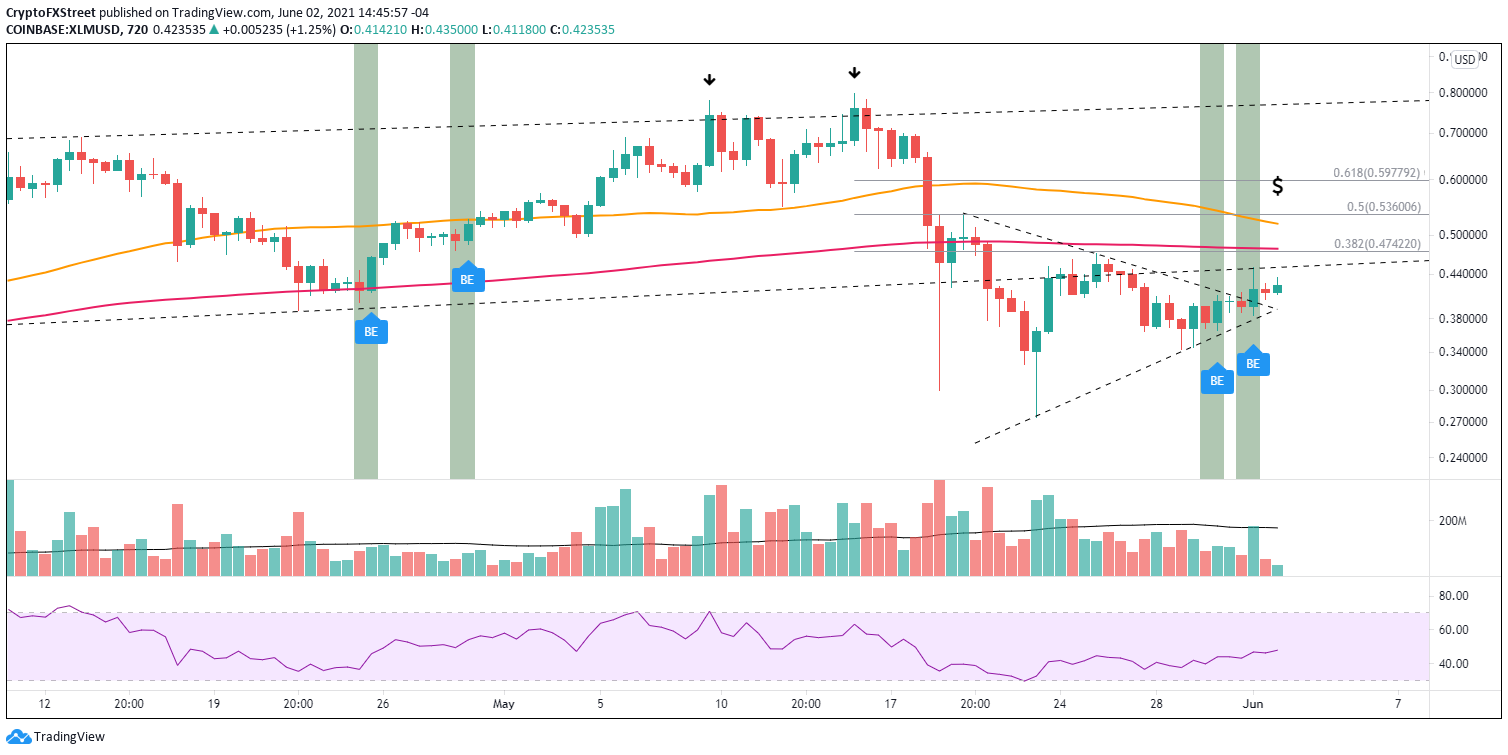
XLM/USD 12-hour chart
Since XLM price did not emerge from the triangle until it was close to the triangle’s apex, it lowers the probability that the breakout will yield a notable gain moving forward. In light of that development combined with the suffocating resistance, Stellar could quickly reverse to the downside if crypto sentiment deteriorates.
Substantial support is at the May 29 low at $0.343. A failure to hold the price level leaves XLM price vulnerable to a test of the May 19 low at $0.300 and potentially the May 19 low at $0.274, yielding a 35% decline from the current price.
As long as the trend is higher, it is fair to lean bullish. Still, the weak bullish engulfing bar following the triangle breakout combined with the closeness of the breakout to the apex should keep investors agile with their market operations. Moreover, investors should employ daily closes to confirm Stellar price action and direction.
Author

Sheldon McIntyre, CMT
Independent Analyst
Sheldon has 24 years of investment experience holding various positions in companies based in the United States and Chile. His core competencies include BRIC and G-10 equity markets, swing and position trading and technical analysis.


