Will there be a Christmas miracle for Ethereum price as FTX unravels?
- Ethereum price rallied over 10% in just three trading days.
- ETH sees bulls breaking down a bearish element.
- Expect a continuation of the fresh uptick that could spiral into an uptrend.

Ethereum (ETH) price jumped for a third consecutive day this morning as the hearings about FTX made several headlines overnight. As more pieces of the puzzle fit into one another, it becomes clearer that FTX might be involved in fraud and that quite a lot of assets have “vanished”. Further questions and inquiries will need to be made, while Binance is once again saying it is more than happy to buy the pieces and elements of FTX worth salvaging.
As cryptocurrencies settle down after these events, global markets are gearing up for Christmas. Not only are equities and indices shooting higher, the almighty US Dollar, which has been the omen for most of 2022, is finally backing off a bit. With several central bankers signaling the terminal rate for interest rates is almost in reach, markets are already popping the champagne with the idea that the worst might be over. Any recession, the thinking goes, will be short-lived with not that much pain, which should provide a massive tailwind for cryptocurrencies now able to at least pair quite big chunks of losses from 2022.
ETH already broke through one bearish element, but which is next?
Ethereum bounced off the low of November 9 on Monday at $1,073.95. The uptick in ETH goes hand in hand with the US Dollar, which has been weakening since Tuesday and was awaiting the Fed minutes from Wednesday night before breaking a crucial bearish element. That bearish element comes from the red descending trend line that originated in September.
ETH now faces the next pivotal bearish level at $1,243.89, which is the low from February 1, 2021. Although shopped out quite heavily, it still bears importance and acts as a guide for the idea that at least one area in the bear market of 2022 looks to be closed off for now. Once breaking above there, another push higher looks to be already near $1,475. The 55-day Simple Moving Average at $1,348 does not seem to hold that much importance as it has not been holding any relevance in the past. Where the monthly pivot and the 200-day SMA do hold importance, expect some profit-taking near there with roughly 22% gains in the books.
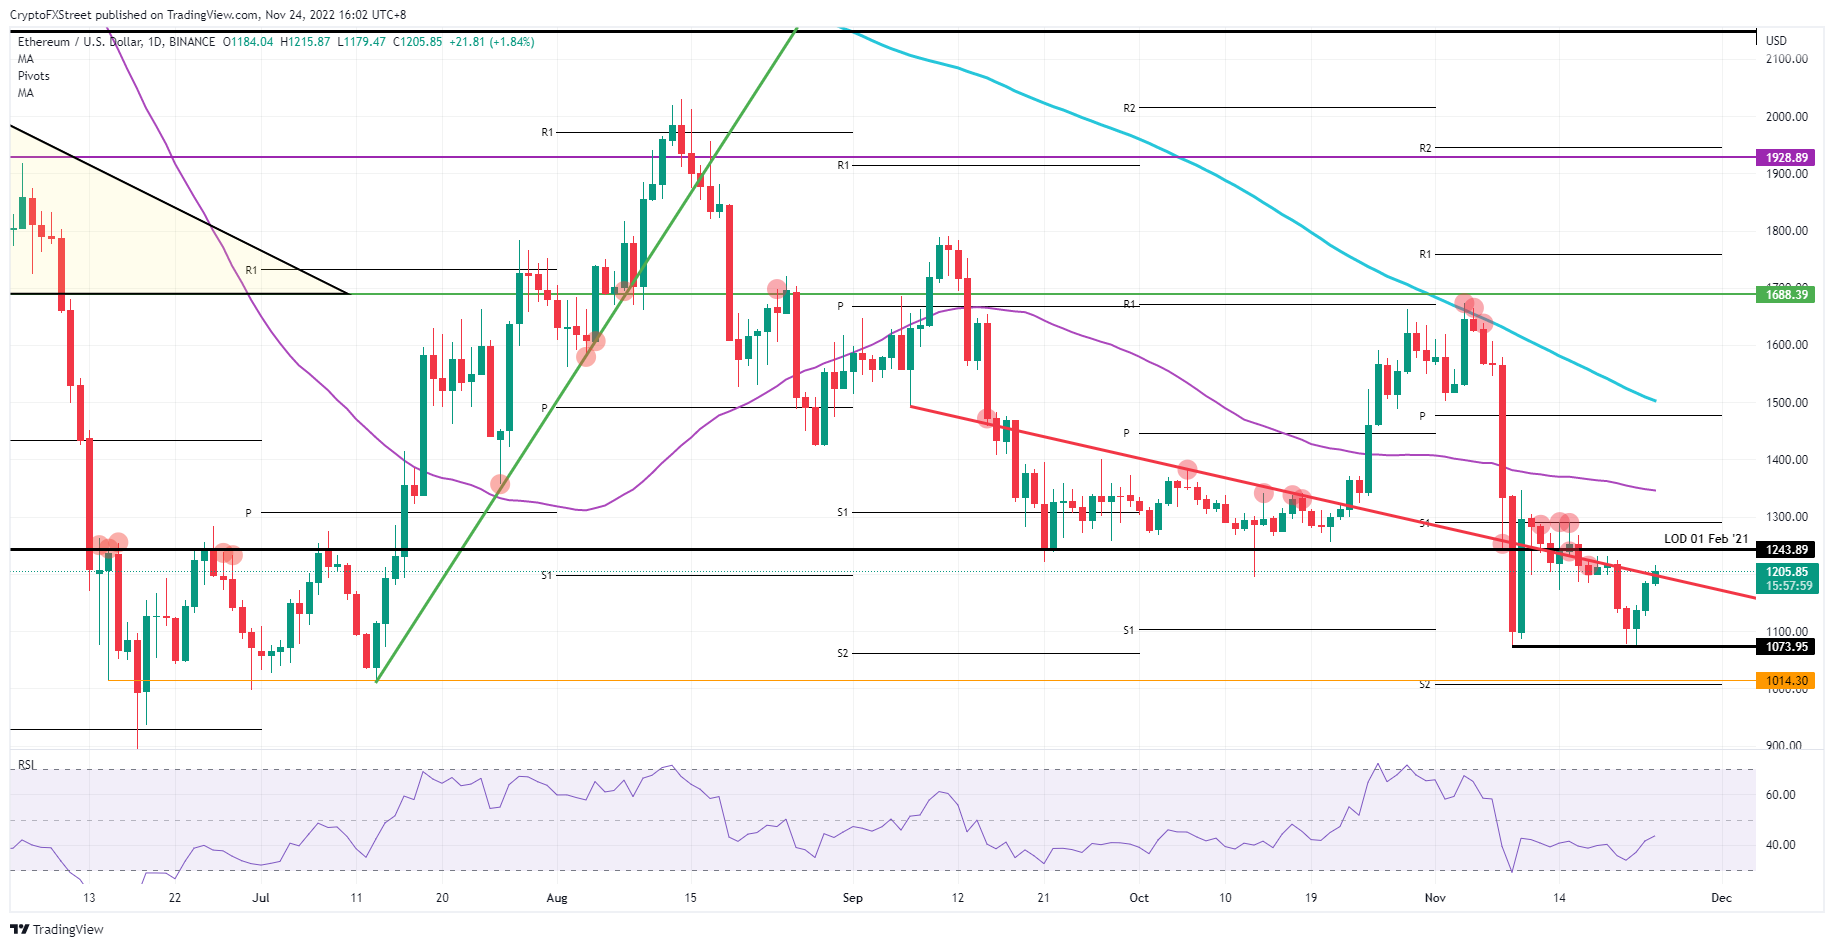
ETH/USD daily chart
As mentioned, this rally goes hand in hand with equities rallying and the US Dollar weaker. If one of those elements starts to fade or turn, expect to see a less steep inclination in the rally. Of course, should both elements start to take a turn for the worse, a collapse of ETH is possible with a drop back to $1,073 to test the flow of November.
Author

Filip Lagaart
FXStreet
Filip Lagaart is a former sales/trader with over 15 years of financial markets expertise under its belt.



