3 indicators for trading Ethereum

Trading Ethereum can be a completely different experience to trading Bitcoin and other cryptocurrencies. While most cryptocurrency will typically move in unison, each Cryptocurrency does still have its own fundamental factors unique to its particular ecosystem, which means that they can move at different intensities and sometimes these unique aspects means they won't move in unison at all.
This can be very much true for Ethereum and it can frequently diverge from general market sentiment and forge its own price action path. As such, Ethereum traders might like to pay attention to indicators that were designed to fit this asset class. In this article we explore three such indicators and their relationship to trading Ethereum.
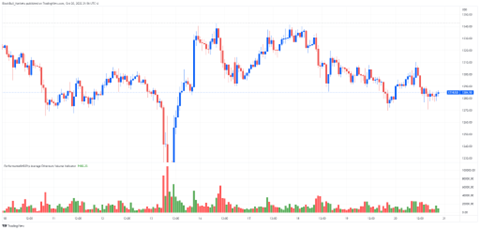
Performante's Average Ethereum Volume Indicator
The Performante's Average Ethereum Volume Indicator uses volume flow from the biggest cryptocurrency exchanges, to determine the average trading volume of the asset. The benefit of this indicator is that you now can see a more accurate and all-encompassing idea of the volume of the asset being traded, rather than a volume flowing through one exchange/ broker.
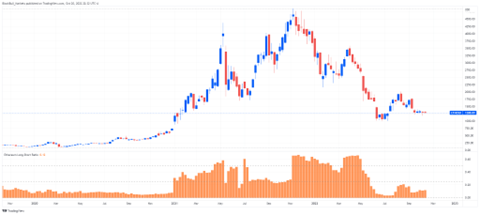
Ethereum Long-Short Ratio
This indicator is important for understanding market sentiment as derived from the number of long traders vs the number of short traders.
Effectively, the higher the ratio (the higher the orange bars) means that long traders out number short traders, the we might have more confidence in the bullish prospect of Ethereum. Conversely, a lower the ratio, or the lowering of the ratio, might indicate the declining bullish prospect of Ethereum.
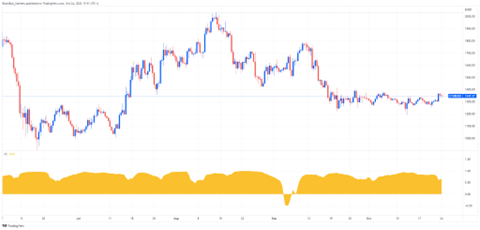
Correlation Coefficient
After you select this indicator, you will be presented with a popup box for you to choose an asset that you can compare with Ethereum. Your selection here could be banking stocks, tech stocks, Bitcoin, another cryptocurrency, or any other asset that aligns with a theory you have about Ethereum moving in relation to the movement in another asset.
The Correlation Coefficient Indicator is range bound between 1 and –1. If the indicator is switching between the bounds of this range or hugging close to 0, it typically means that the relationship between the assets is not very strong or predictable (as 0 indicates no correlation). What you want to watch out for are assets where the indicator remains close to 1 (as this indicates a high positive correlation) or -1 (as this indicates a high inverse correlation). Either way, a positive or inverse relationship can be used to help determine the movement of Ethereum via this other asset.
Author

Mark O’Donnell
Blackbull Markets Limited
Mark O’Donnell is a Research Analyst with BlackBull Markets in Auckland, New Zealand.


