Will Shiba Inu price provide buy signal before exploding to $0.0000200
- Shiba Inu price tightens in a range after crashing roughly 30% between August 14 and 20.
- Investors can be optimistic about a retest of the volume point of control at $0.0000118 if it arrives.
- A daily candlestick close below $0.0000118 will invalidate the bullish thesis.
Shiba Inu price is looking to find a stable support floor that doubles as a launching pad after it undid its explosives rally in under a week. This development could take SHIB to the volume point of control (POC), where large buyers are likely to step in and trigger another rally.
Shiba Inu price in a bullish retracement
Shiba Inu price completely undid its 35% rally on August 14 over the next six days. This development is a sign of overwhelming holders scrambling to book profits. However, the retracement seems to have brought SHIB close to the POC at $0.0000118.
The aforementioned barrier is a support floor since it is the highest traded volume level since April 11. Therefore, investors can expect buyers to step in at this barrier, potentially triggering another rally.
In such a case, investors can expect SHIB to revisit the previous swing high at $0.0000179 and form a local top here. However, if the momentum persists, this uptrend could extend to the immediate resistance level at $0.0000200, constituting a 68% gain.
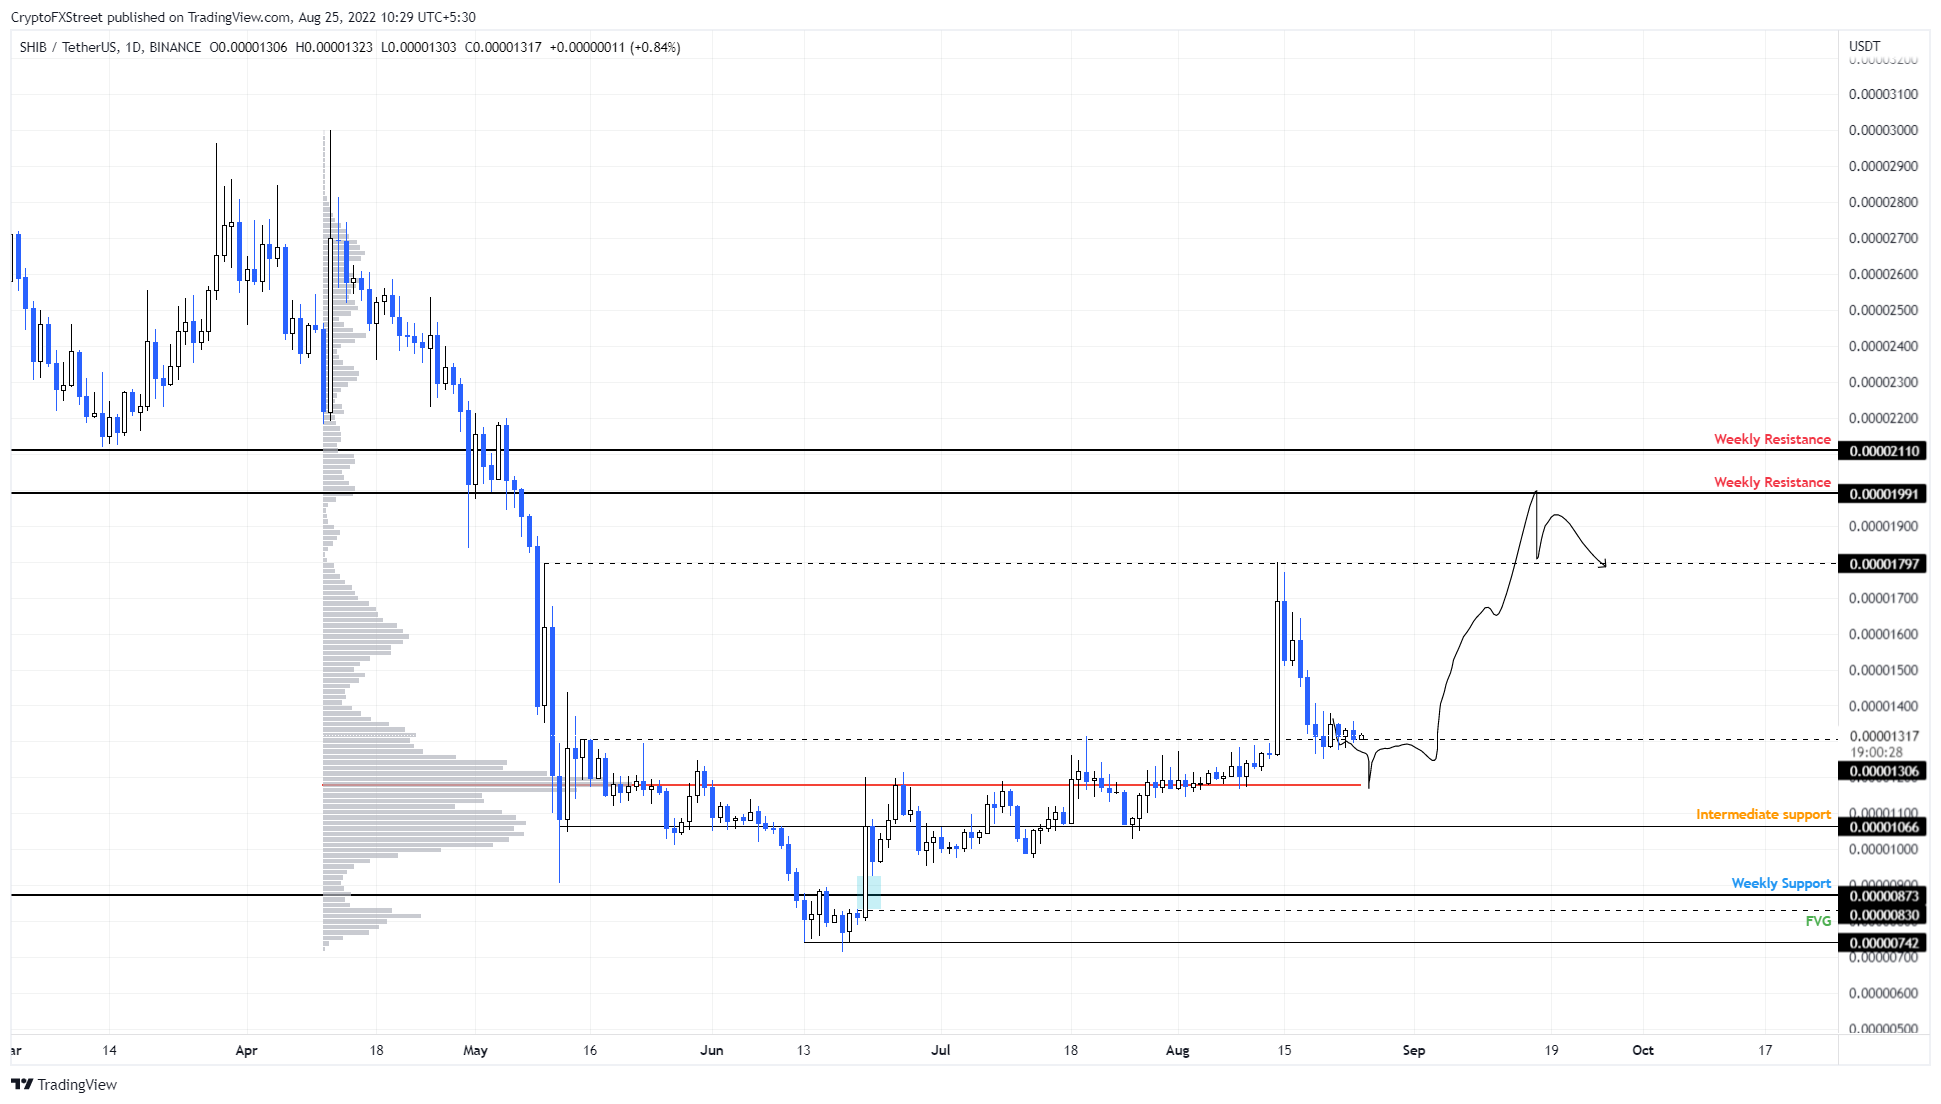
SHIB/USDT 4-hour chart
Regardless of optimism, if the POC fails to hold and sellers push Shiba Inu price to flip the $0.0000118 barrier into a resistance level, it will invalidate the SHIB recovery outlook. This development could see SHIB nosedive with an increase in sell pressure and retest the $0.0000106 foothold.
Author

Akash Girimath
FXStreet
Akash Girimath is a Mechanical Engineer interested in the chaos of the financial markets. Trying to make sense of this convoluted yet fascinating space, he switched his engineering job to become a crypto reporter and analyst.


