Why you should capitalize on this 60% upswing in Solana price
- Solana price has been on a downtrend for more than six months, but things are changing for the better.
- A bullish divergence ‘buy signal’ could trigger a 60% ascent in SOL to $66.19.
- A daily candlestick close below $36.98 will invalidate the bullish thesis.

Solana price shows an interesting divergence on the high time frame chart that could kick-start a much needed swing rally. Therefore, investors need to pay close attention to SOL, which could allow patient buyers to capitalize on this opportunity.
Solana price ready for a quick run-up
Solana price has crashed 86% since its all-time high at $261.57 on November 6, 2021. This downswing is the same for altcoins, which have taken a massive haircut. Regardless, a trend line can be drawn connecting two lower lows for SOL, suggesting the possibility of a support trend line.
However, a much closer look at the recently formed swing lows on May 12 and May 26, suggests the potential for a bullish divergence. This technical formation contains an asset producing lower lows while the momentum indicator produces higher lows.
For Solana price, the Relative Strength Index (RSI) has set up higher lows, while the SOL has created lower lows. This setup resolves in a way that allows the underlying asset’s market value to rise.
Therefore, investors can expect Solana price to do the same. Considering the bullish flip in Bitcoin price and the possibility of a move to $35,000, investors can expect SOL to piggyback off the BTC’s bullishness and tag the range low at $66.19, indicating a 60% ascent.
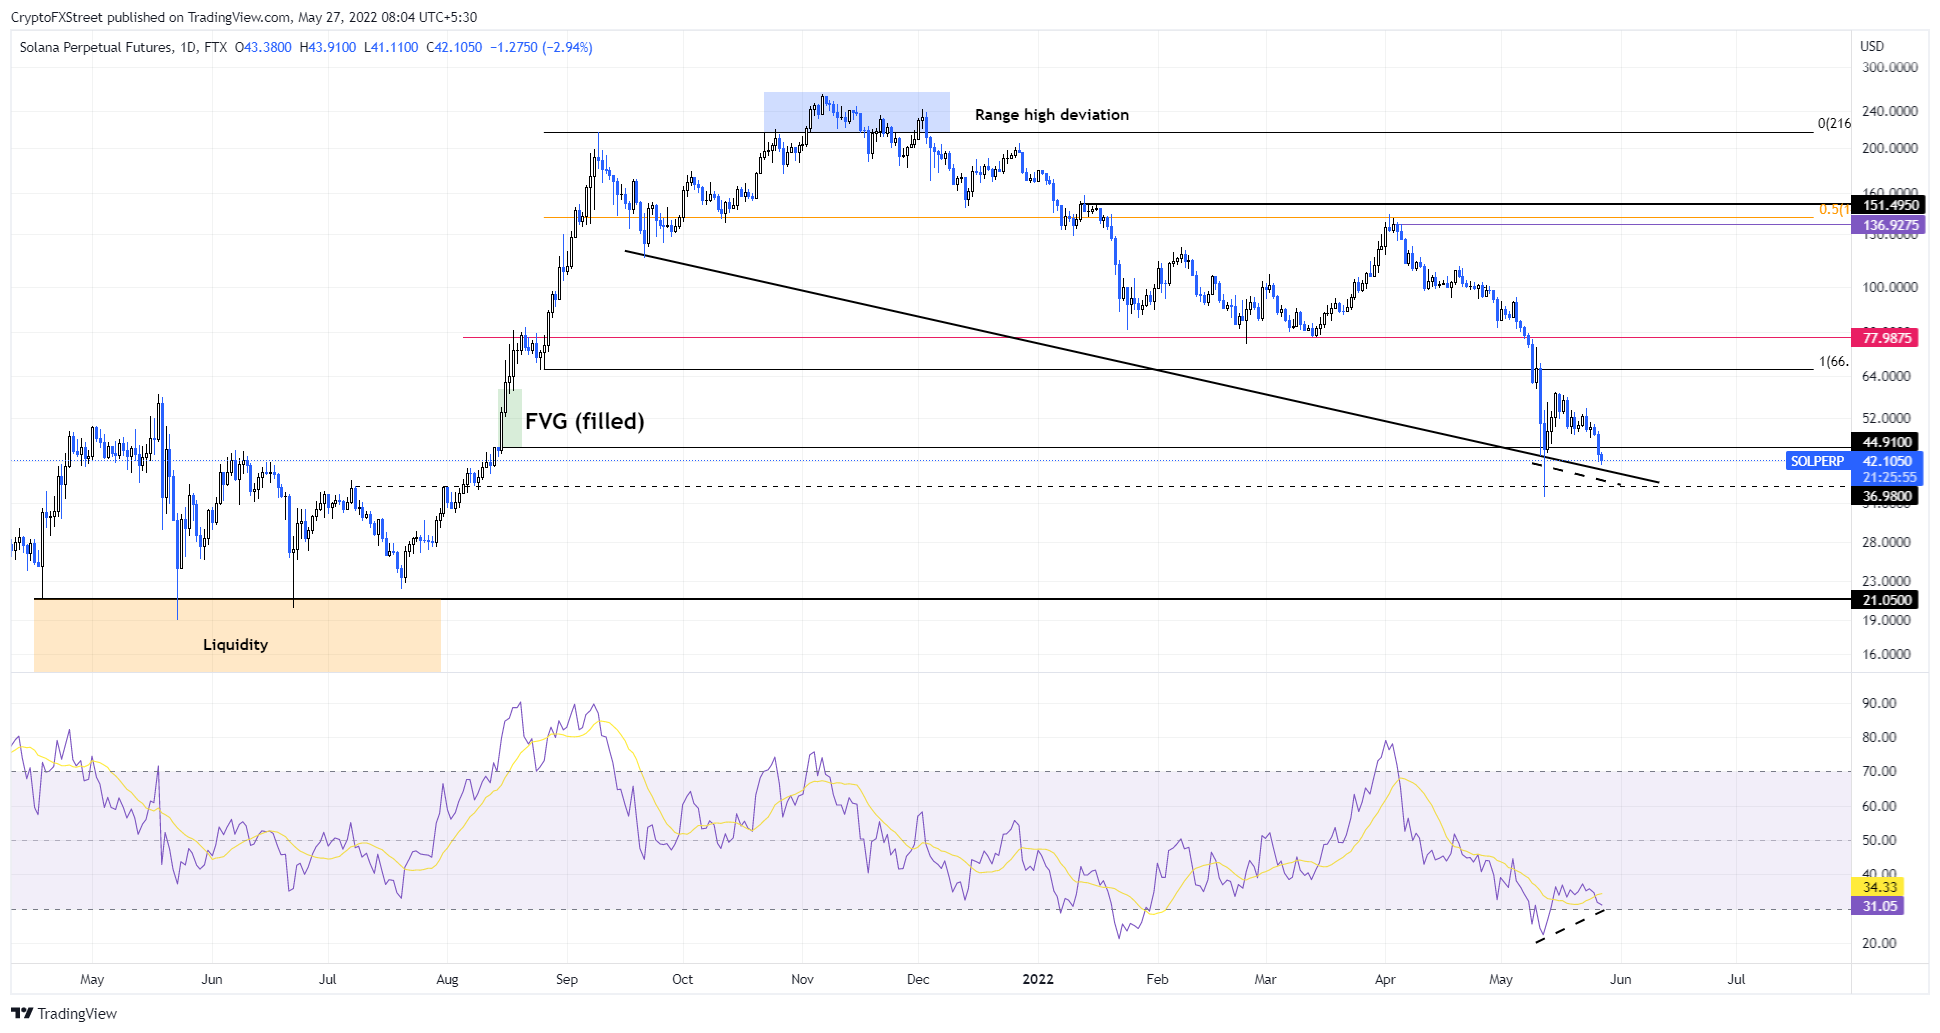
SOL/USDT 1-day chart
Regardless of the bullish outlook, if Solana price continues to descend, it will undo the bullish divergence outlook. In such a case, if SOL produces a daily candlestick close below $36.98, it will create a lower low and invalidate the bullish thesis for SOL. In this case, Solana price could crash to $21.05.
Author

Akash Girimath
FXStreet
Akash Girimath is a Mechanical Engineer interested in the chaos of the financial markets. Trying to make sense of this convoluted yet fascinating space, he switched his engineering job to become a crypto reporter and analyst.