Why XRP price at $20 seems more plausible than $589
- XRP price nears the end of a bullish pattern that is more than four years old.
- A breakout from this setup could push Ripple to $3 and higher.
- A daily candlestick close below $0.59 will invalidate the bullish thesis for the remittance token.
XRP price shows an extremely optimistic setup that forecasts a retest of its all-time high and a double-digit target. On-chain metrics show that whales have been accumulating Ripple, adding credence to the thesis.
XRP price and its insane valuation
XRP price is forming a bullish setup known as Cup-and-handle. As the name implies, there are two parts to the pattern: the cup – a bowl-shaped ‘rounding bottom’ section of price action – and the handle – a subsequent smaller dip or consolidation.
A breakout from the handle's trading range confirms the pattern and signals a continuation of the prior ascent. The target for this setup is obtained by measuring the distance from the right peak of the cup to the bottom of the cup.
If the distance is measured from top to bottom, the 93% upswing projects a target at $2.98. However, from a bottom-up approach, the 1,329% distance forecasts a target of $21.38. The latter is apt to be used during bull runs, where altcoins often yield returns in multiples.
XRP price needs to produce a three-day candlestick close above the trend line connecting the peaks of the cup and bottom at roughly $1.57. Doing so would indicate a breakout and trigger the forecasted bull rally.
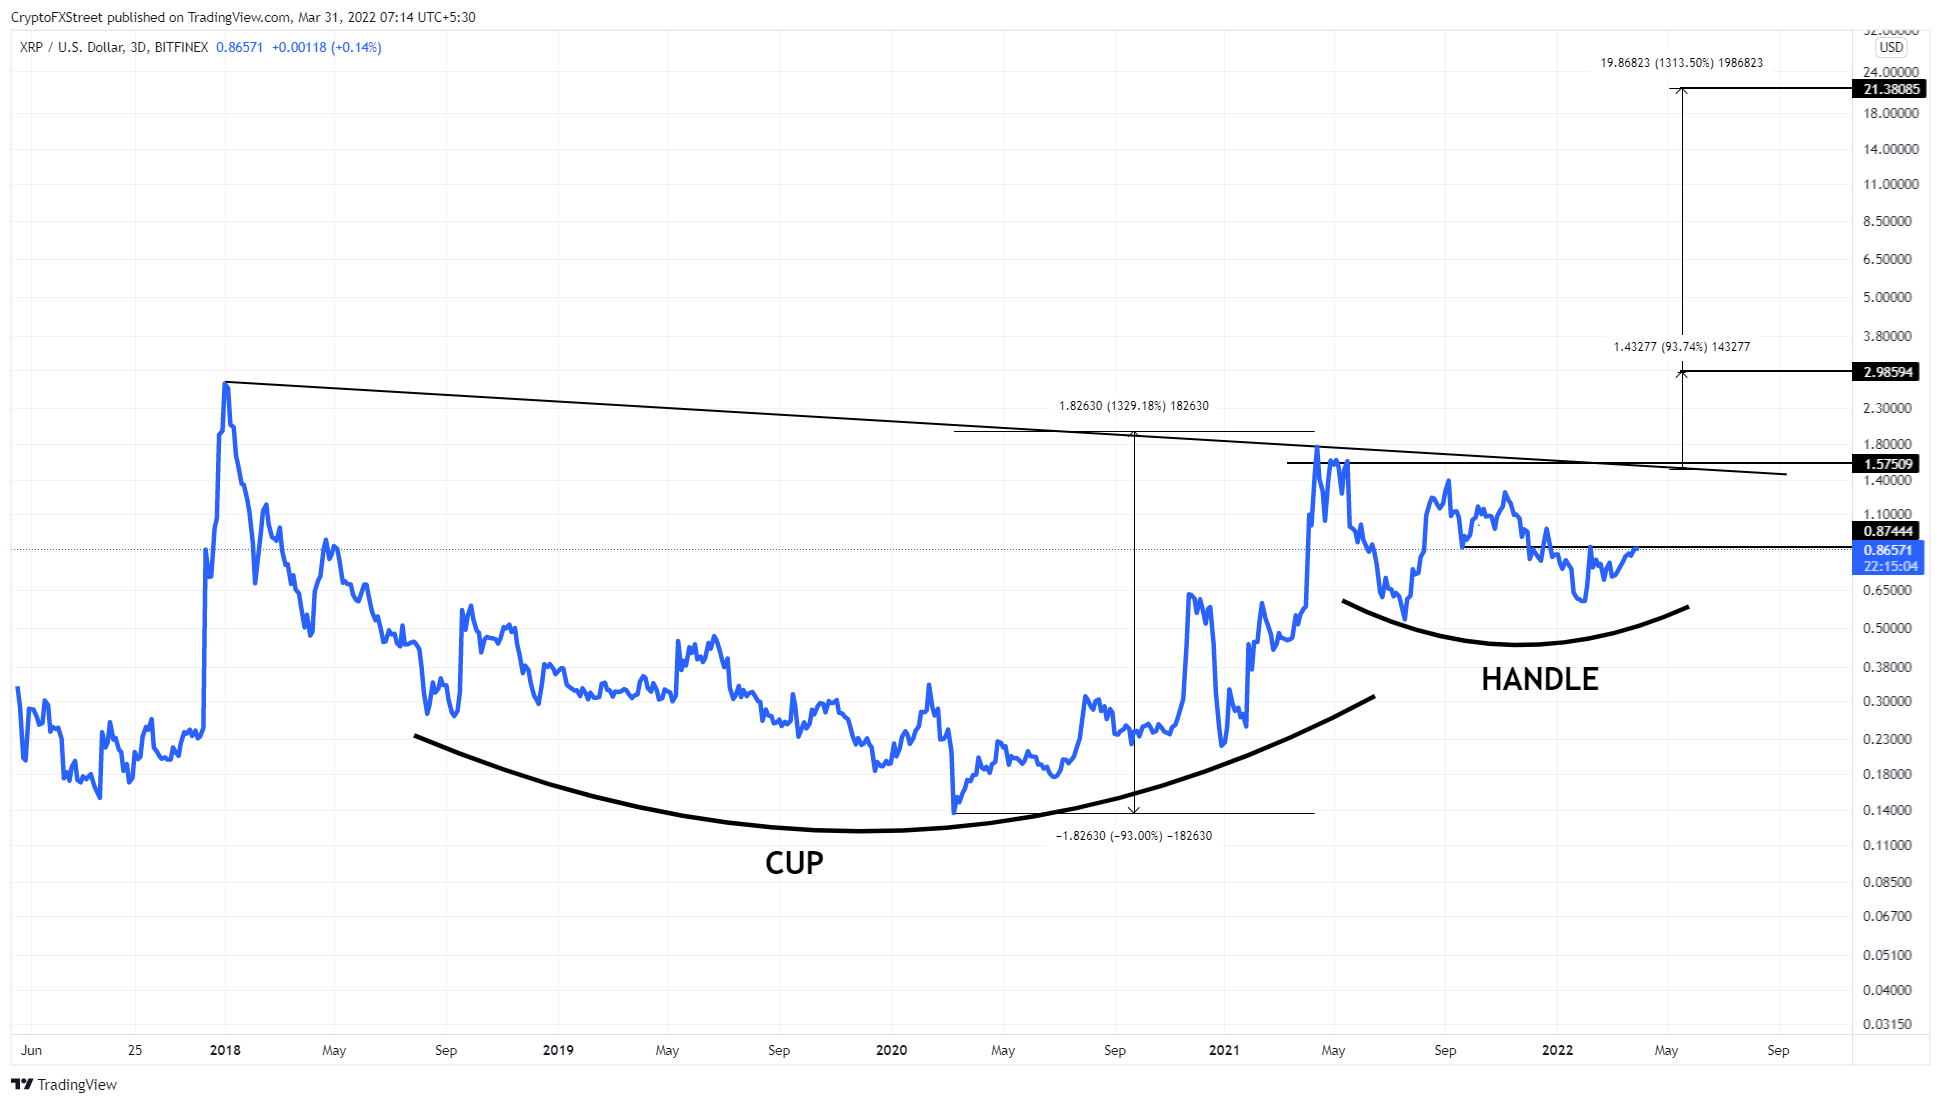
XRP/USDT 3-day chart
While the technicals forecast an uber bullish outlook, the on-chain volume for XRP price shows a constant decline since May 2021. Interestingly, volumes often need to drop substantially before a breakout and increase right after to pave the way for a volatile move.
Currently, the volume is hovering around 1.8 billion, which is 20x below its peak in May 2021 – a humongous deterioration.
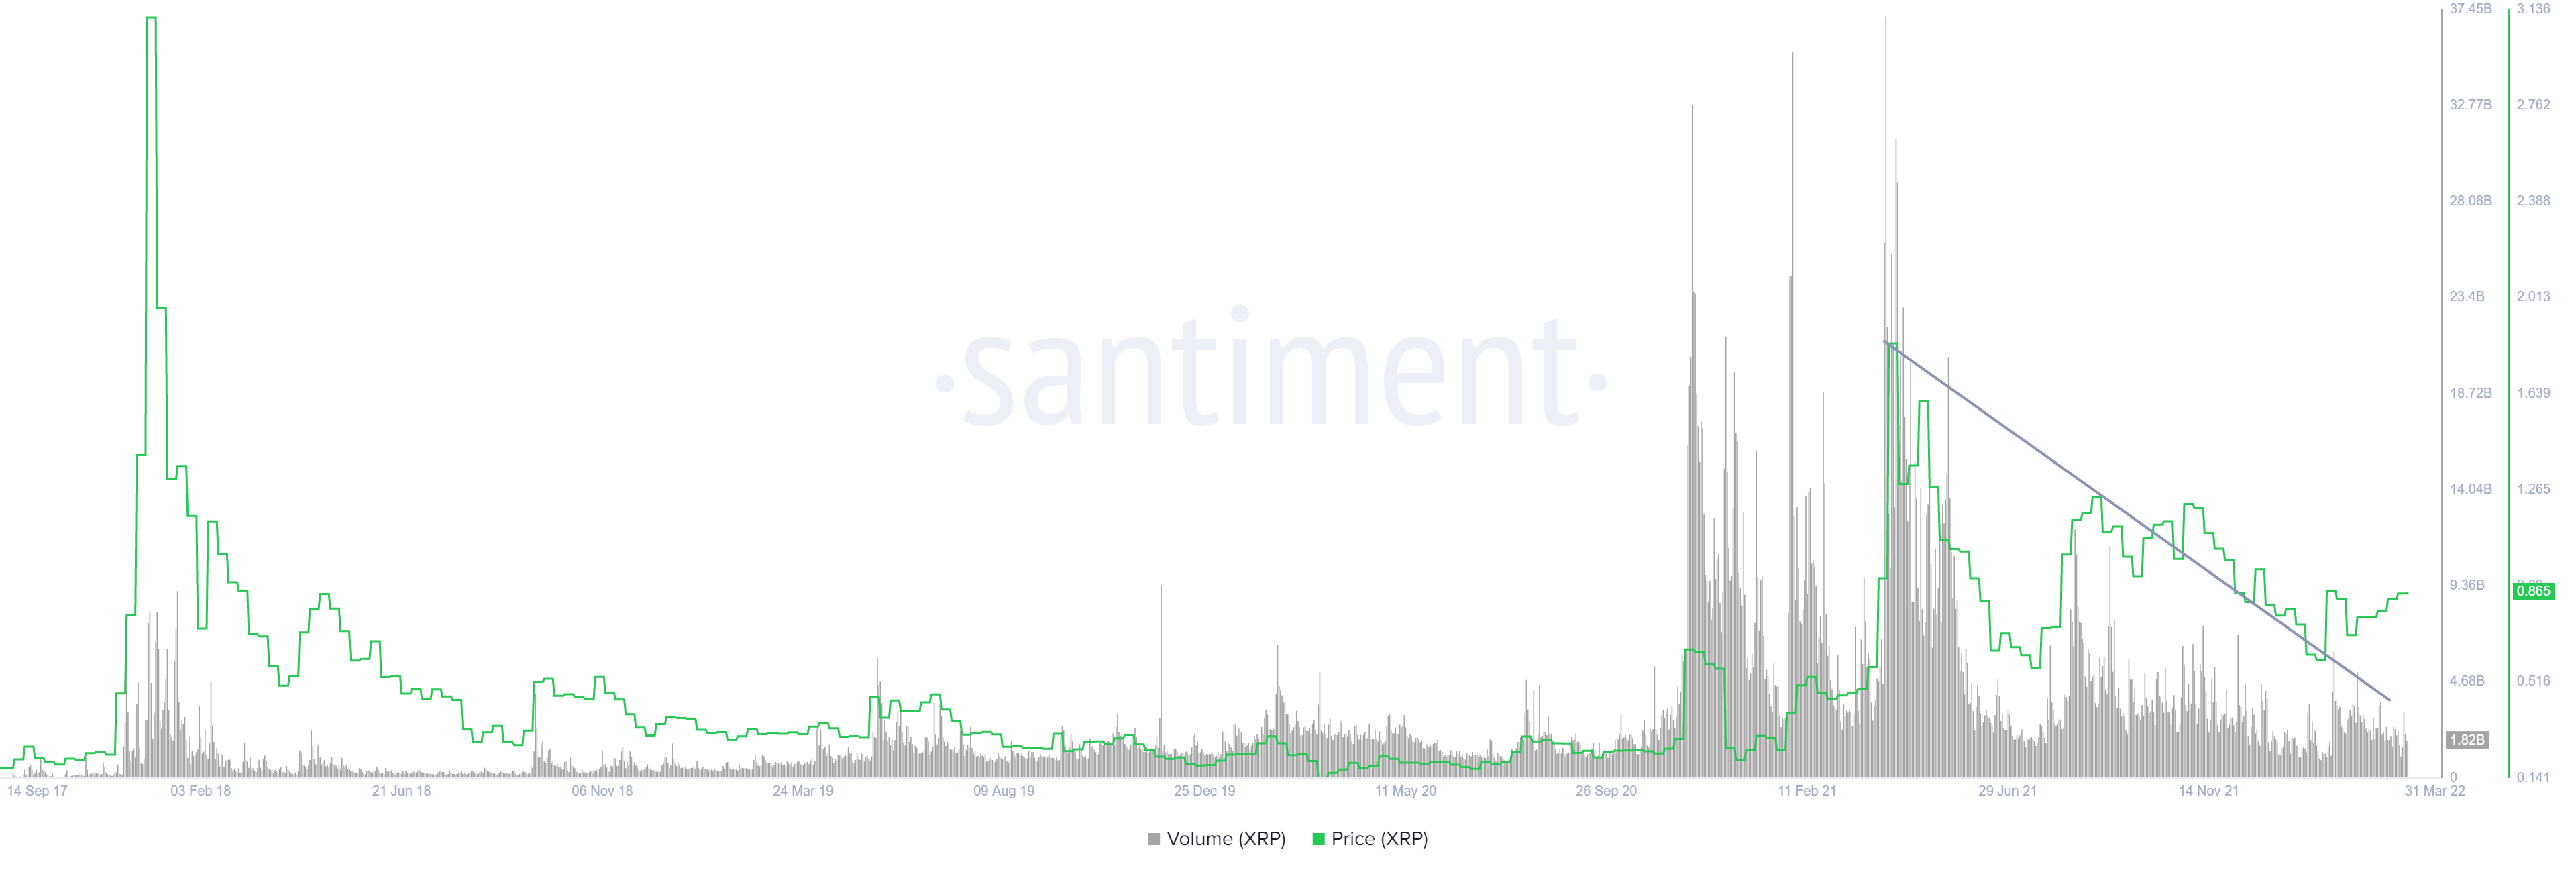
XRP on-chain volume
Further supporting a massive upside for XRP price is the 365-day Market Value to Realized Value (MVRV) model. This on-chain metric is used to determine the average profit/loss of investors that purchased XRP over the past year and is currently hovering around -8.2%.
Since 2021, the 365-day MVRV has peaked anywhere between 15% to 82%. Most of these peaks coincide with a local top for XRP price. Therefore, if history were to repeat itself, there is still massive upside potential for XRP price, which coincides with the outlook from a technical standpoint.
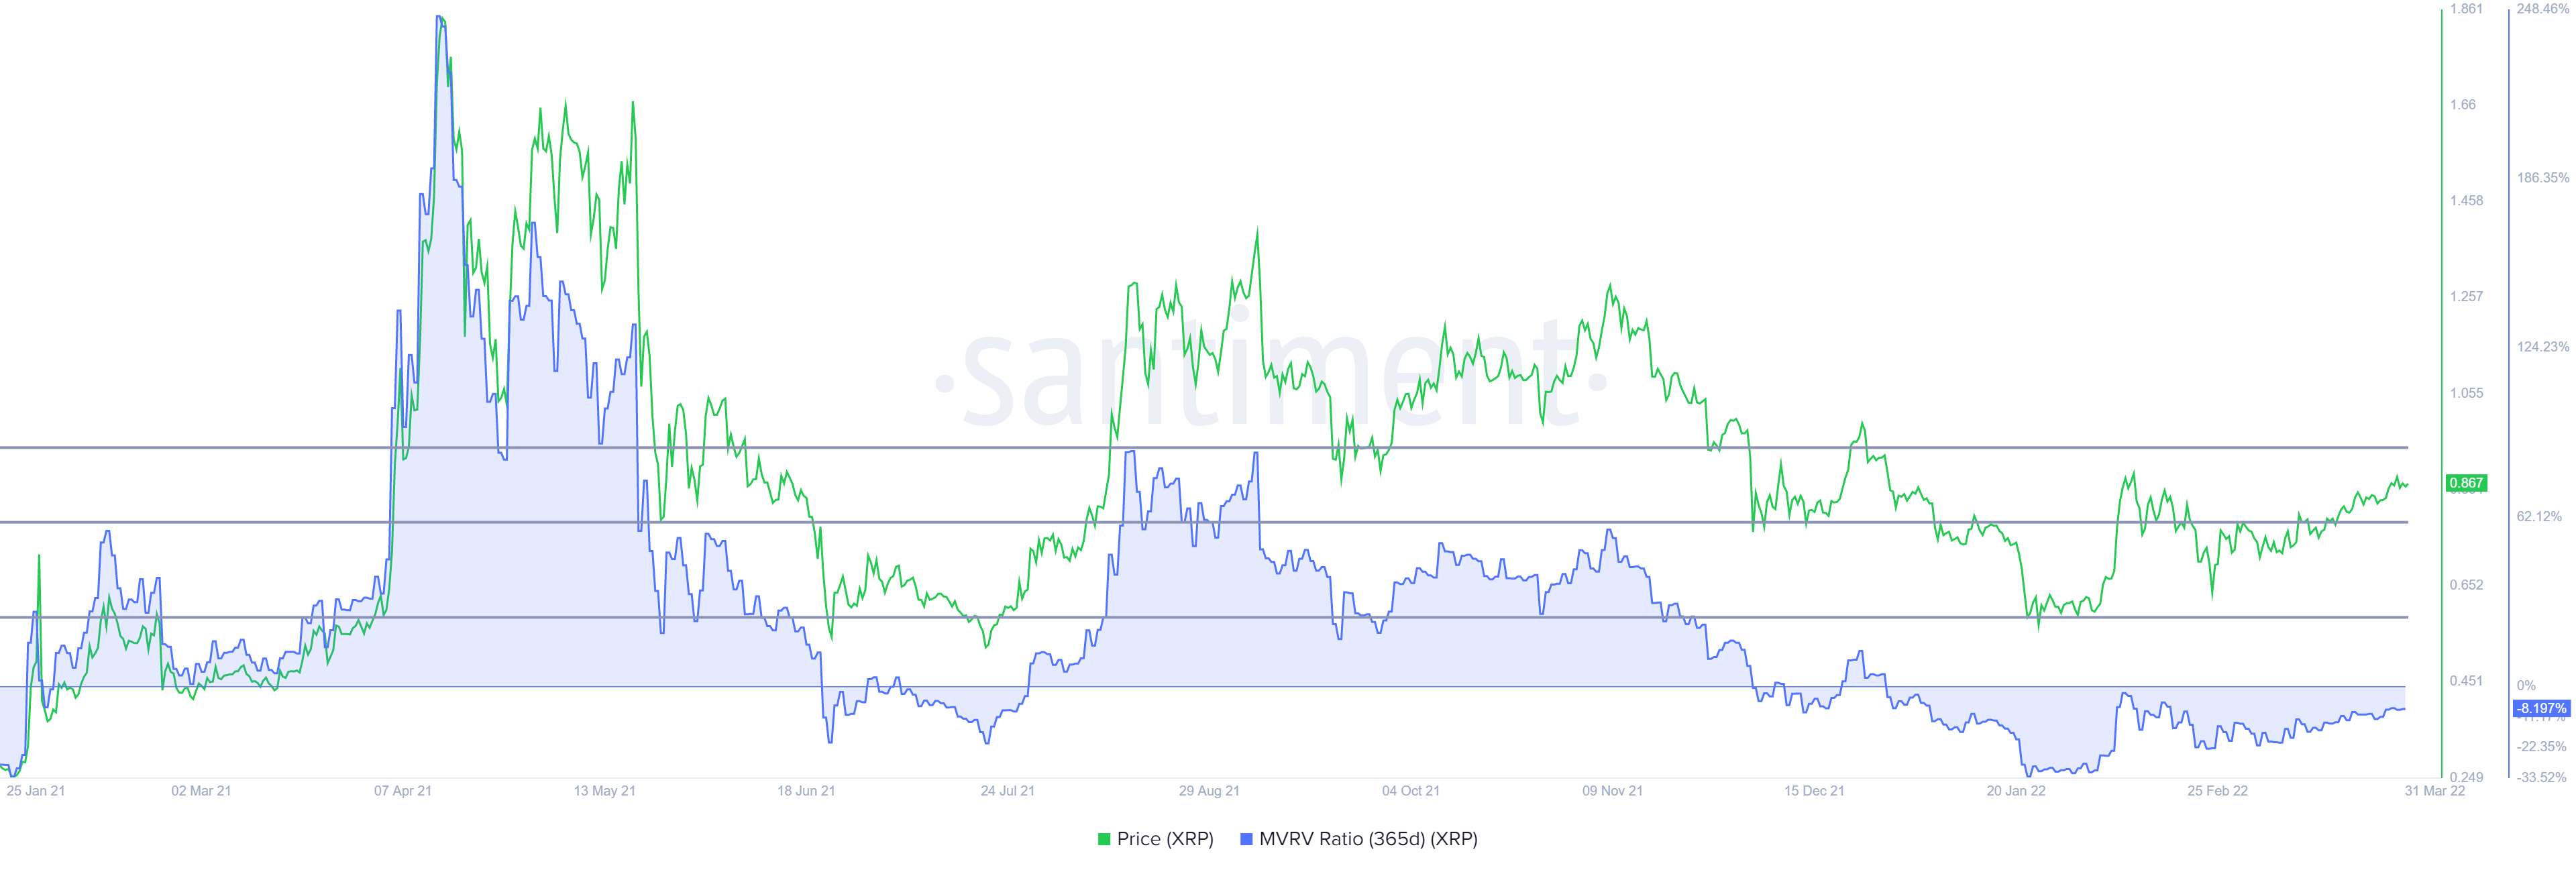
XRP 365-day MVRV
Perhaps the most interesting outlook for XRP price comes from supply distribution based on the number-of-holders chart. The chart below tracks the number of investors that hold 100,000 or more XRP tokens.
These holders are classified into 100,000 to 1,000,000, 1,000,000 to 10,000,000 and 10,000,000 categories.
The number of these holders have been in an uptrend since January 31, 2021, and shows no signs of slowing down even after the recent crash in January 2022. This spike in whales or even institutions indicates only one thing - these investors are bullish on XRP price performance and they expect better things from the remittance token.
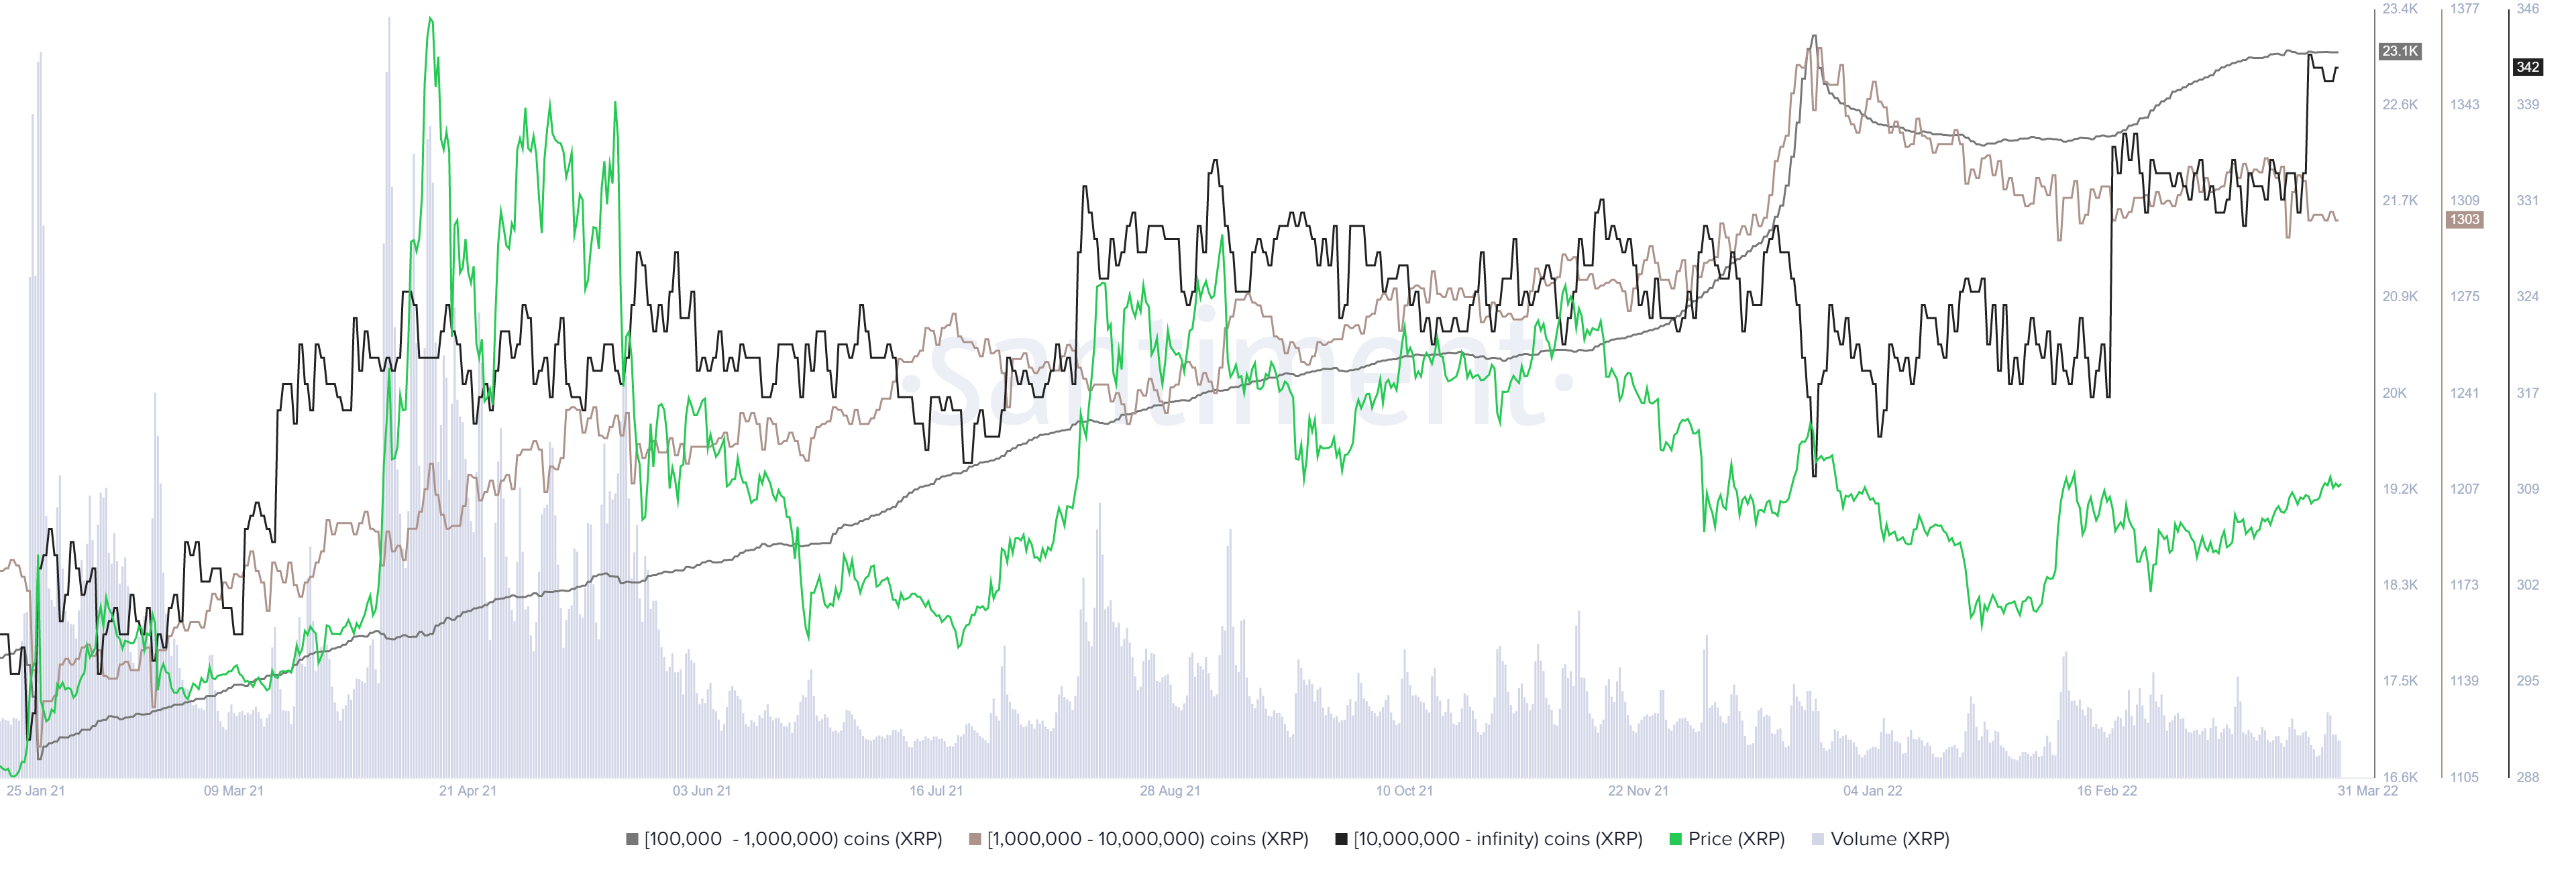
XRP supply distribution
While things are looking up for XRP price, a flash crash in Bitcoin price could easily translate to altcoins, including Ripple. In such a case, a daily candlestick close below $0.59 will invalidate the bullish thesis for XRP price. This development is key and could trigger a crash to $0.50 in a highly bearish case.
Author

Akash Girimath
FXStreet
Akash Girimath is a Mechanical Engineer interested in the chaos of the financial markets. Trying to make sense of this convoluted yet fascinating space, he switched his engineering job to become a crypto reporter and analyst.


