Why the Cardano price is forcing investors to live by the HODL mentality
- Cardano price has produced five months of persistent downtrend price action.
- ADA has rallied by 10% since the start of January.
- ADA could rally between 45-120% if the crypto market can prompt a reversal.

Cardano price has endured nonstop losses since August of 2022. At some point, the Cardano price should show a substantial reversal. Key levels have been defined to gauge ADA's future price action.
Cardano price and the persistent downtrend
Cardano price is currently by 92% since tagging all-time highs at $3.10 in September of 2021. 52% of the losses accrued are attributable to the bear's effort over the last five months, as the ADA has produced five straight red months in a row.
Cardano price currently auctions at $0.273. Since January 1, the bulls have prompted a 10% countertrend spike. One of the more interesting aspects of ADA's mudslide demise is shown on the Volume indicator. Throughout the 92% downswing, the volume profile has remained relatively unchanged and is consistently waning. This is a subtle reversal cue for long-term swing traders to remain optimistic and "hold on for dear life" during the bearish onslaught. Normally the fading volume indicator is displayed before stunning trend reversals occur.
If the Cardano price can pull off a crypto-180, key levels to aim for would be the broken support level at $0.40 and the $0.63 liquidity zone that has to remain untagged throughout the downtrend. The Cardano price potentiates a rally between 45-120% from ADA's current market value.
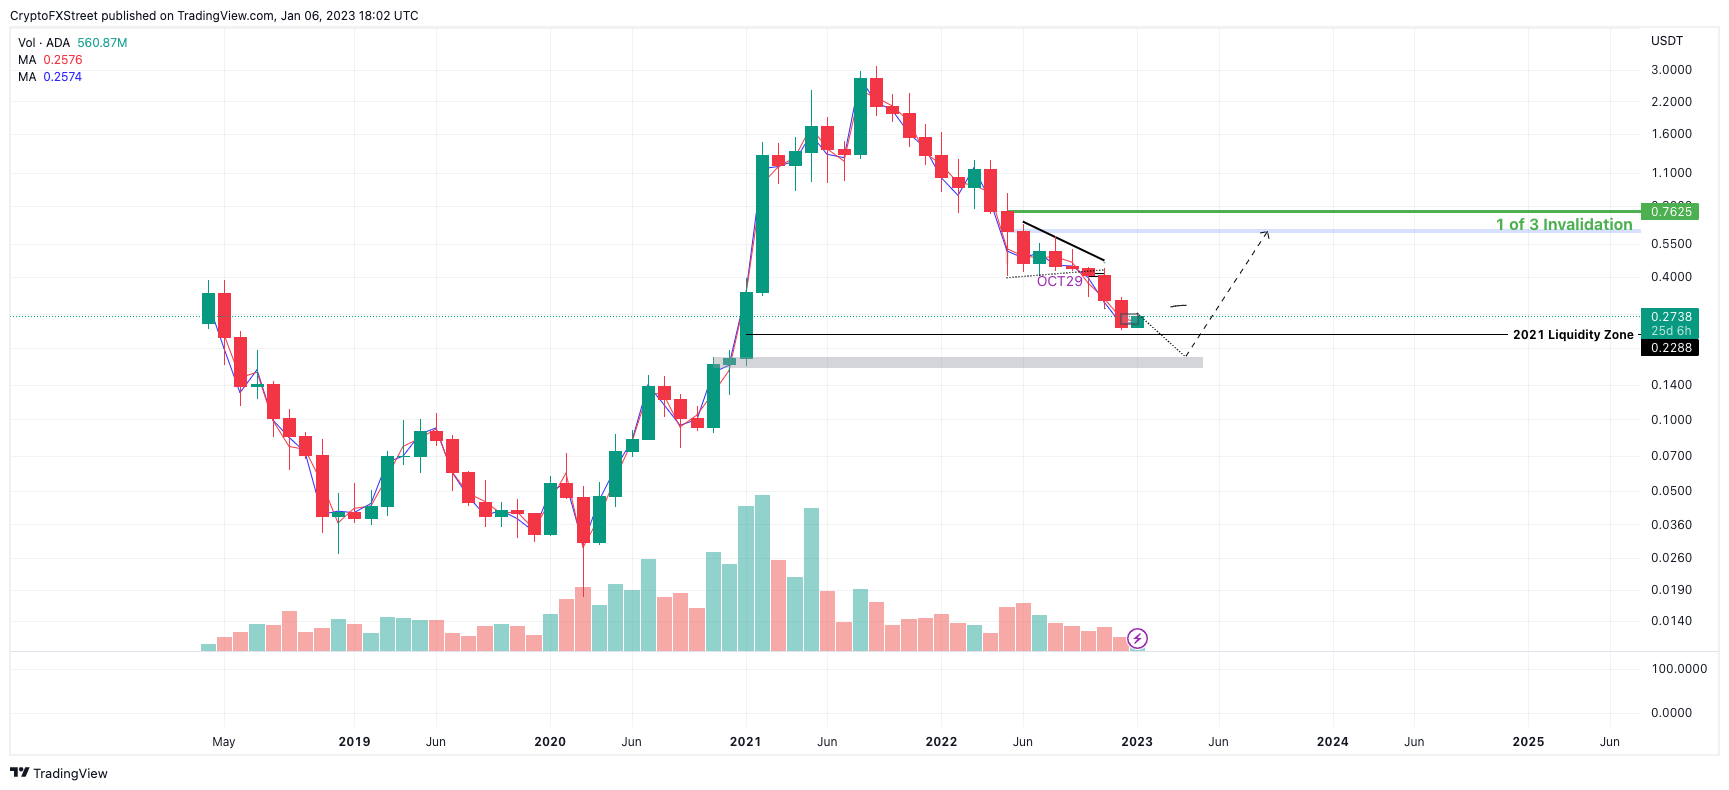
ADA/USDT 1–Month Chart
Still attempting to catch the knife can lead to more losses as the downtrend shows no reversal candlestick on the monthly time frame. Since the bears closed December bearish with a 23% loss, the downtrend still has the potential to decline lower with a key level at $0.18, an untagged liquidity zone established during the 2020-2021 bullrun. A breach of the level would result in an additional 30% loss from the current Cardano price.
Author

Tony M.
FXStreet Contributor
Tony Montpeirous began investing in cryptocurrencies in 2017. His trading style incorporates Elliot Wave, Auction Market Theory, Fibonacci and price action as the cornerstone of his technical analysis.


