Why Solana price action is going nowhere
- Solana price is at risk of collapsing as price action weekly is not moving.
- Where major cryptocurrencies are enjoying the summer rally, SOL price stalls.
- Expect a drop below support and possible falling knife to $19.

Solana's (SOL) price, from a first glance at the sheet, looks bullish and set forth to continue its rally and winning streak. However, a closer look under the hood reveals that on a weekly chart, price action is going nowhere and could soon collapse once a tail risk gets inflated again. With the end of the summer at hand, the volume starts to pick up again, and this rally could as easily start to fade out as it did in July.
SOL price stands to drop 55%
Solana is trying to hold on to its weekly gains and continue its rally from July after last week's hike, although the 55-day Simple Moving Average supported price action. Looking a bit closer to the bodies of the candles, where they open and close, it reveals that price action SOL is not going anywhere since the last of July, price action has been opening and closing around the same levels. Sure, there have been swings to the upside and the downside, but the bodies show no sign of actual higher or lower movent within three weeks.
Although looking bullish, SOL price could give a false sense of security and be caught by a bearish surprise. Keep a close eye on that 55-day SMA, as that is key from now on. Once that level gives, expect to see first the monthly S1 supporting around $33.63 before turning into a falling knife towards $19 and standing to lose 55%.
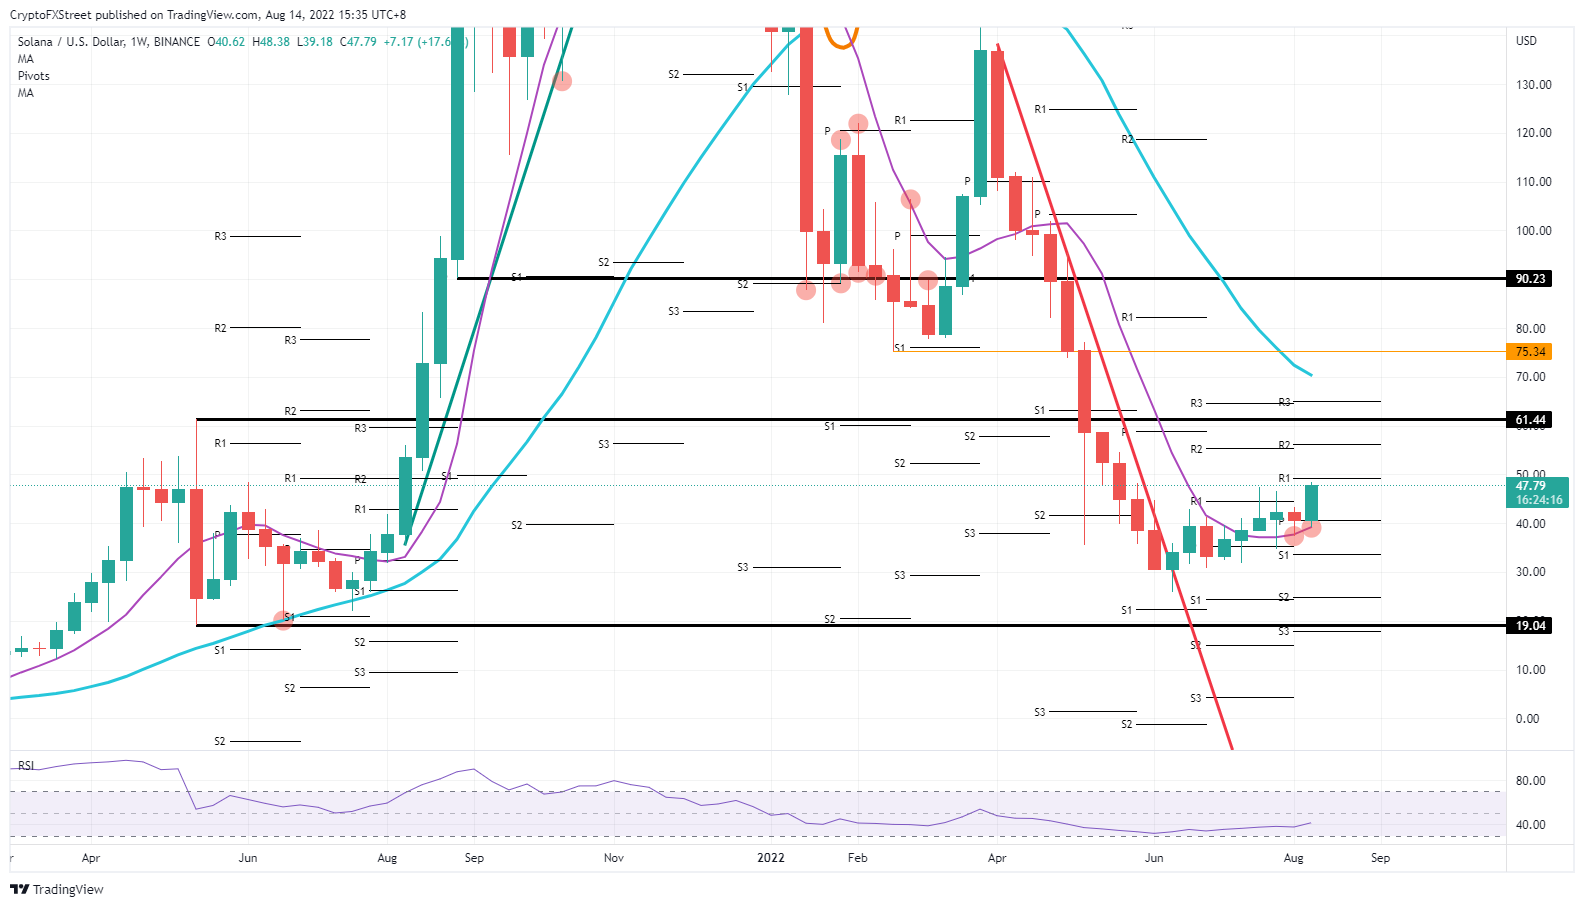
SOL/USD Weekly chart
An upside surprise would come from some more positive catalysts next week with a few economic data points that could revamp the drop in US inflation and continue to confirm that households are starting to have more disposable income. A quick lift in price action would happen towards $50, just above the monthly R1 for next week and then by the end of August, $61.44 should be tested or even broken to the upside.
Author

Filip Lagaart
FXStreet
Filip Lagaart is a former sales/trader with over 15 years of financial markets expertise under its belt.



