Why SafeMoon price could make a new all-time low
- SafeMoon price slides further south, continuing its bearish trend.
- Strong and persistent selling pressure is likely to remain.
- Some bullish divergence exists, but follow-through by buyers is necessary.

SafeMoon price action continues to frustrate bulls. The trend is not only bearish, but consistent new all-time lows on the daily Ichimoku chart continue to be made. Adding insult to injury, there is no evidence of any support as price is in discovery mode.
SafeMoon price faces a 27% drop if buyers remain absent
SafeMoon price has a probable value area to hit and possibly find buyers at the psychological $0.00035 value area. $0.00035 is the 100% Fibonacci extension of the March 30 swing high at $0.00130 to the April 18 swing low at $0.00058.
However, bears may find it increasingly difficult to push SafeMoon price even lower. This is because the Relative Strength Index has stubbornly held onto the first oversold level in a bear market (30) and shows marked resilience at that level.
Most importantly, for bulls, is the regular bullish divergence now present between price action and the Composite Index. If the Composite Index can cross and close above both of its moving averages, that would generate the strongest bullish signal in SafeMoon’s oscillators since late March 2022.
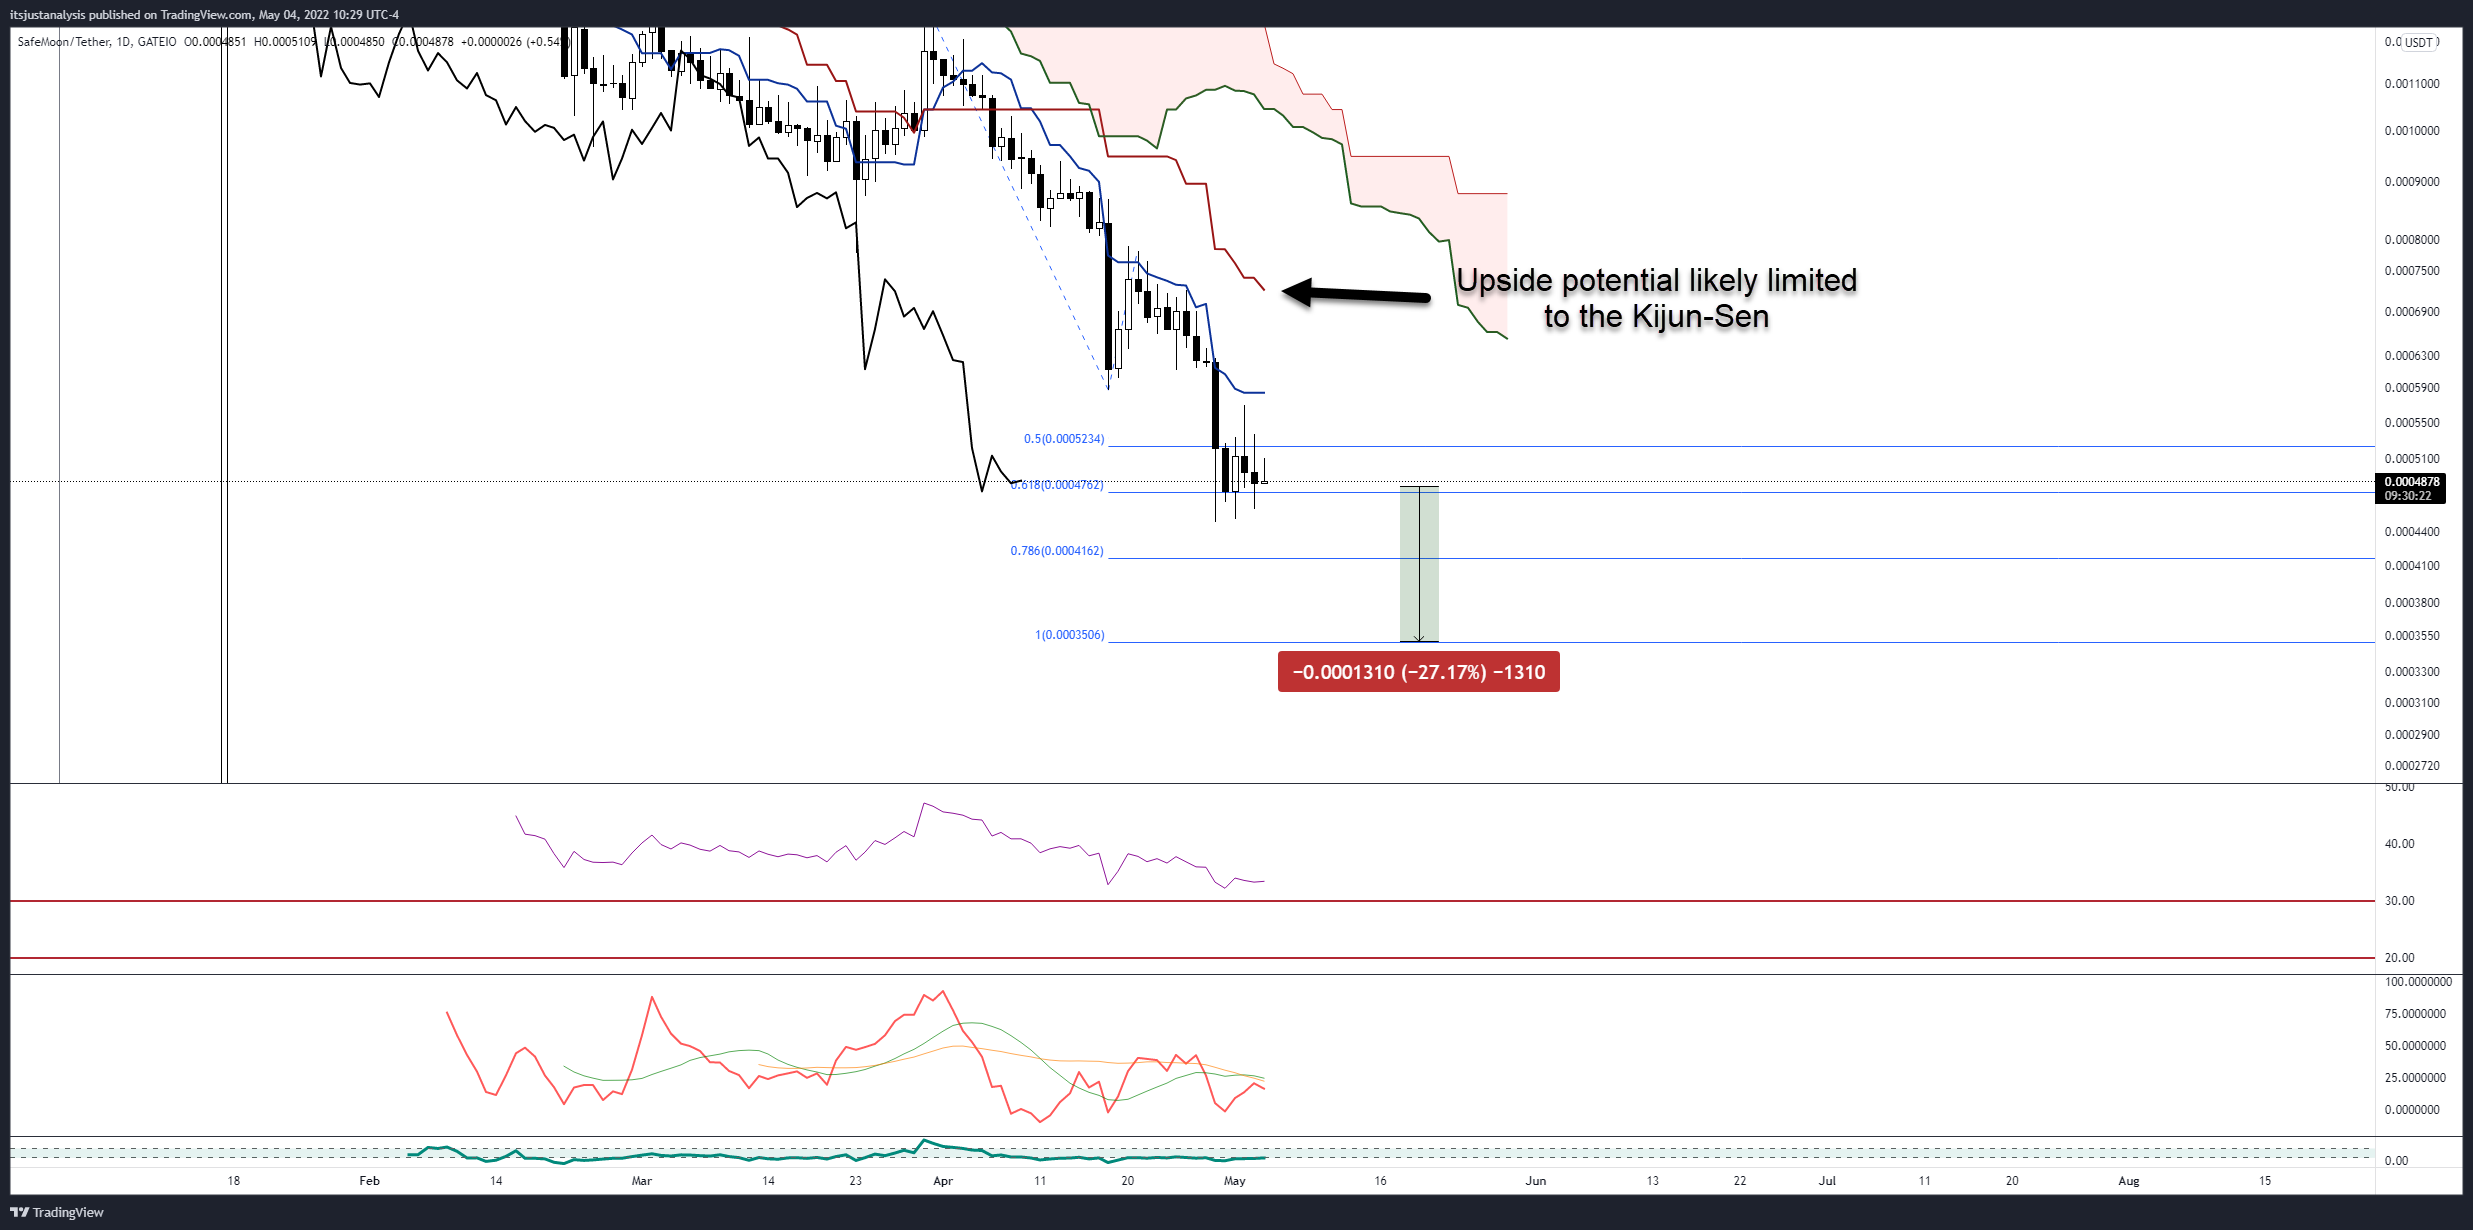
SafeMoon/USDT Daily Ichimoku Kinko Hyo Chart
Bears may not want to become overly confident as there are noticeable gaps between the candlesticks and the Tenkan-Sen, suggesting an overstretched market. Furthermore, SafeMoon price is close to the max-mean range from the Kijun-Sen. In other words, a mean reversion higher is increasingly probable.
Any upside potential is likely limited to the Kijun-Sen at $0.00072. However, a close above $0.00072 would probably set up SafeMoon price for a reversal of the current trend where it may begin the establishment of a support base before moving higher.
Author

Jonathan Morgan
Independent Analyst
Jonathan has been working as an Independent future, forex, and cryptocurrency trader and analyst for 8 years. He also has been writing for the past 5 years.



