Why the Algorand price is devastatingly bearish as of late
- Algorand price fell by 25% during December.
- ALGO is now auctioning within 2020’s trading range.
- The bears may be able to induce a 50% downswing sometime in 2023. Invalidation requires a monthly settlement above $0.227.

Algorand price has shaken investors to the core as market makers have forged a monthly close within 2020’s trading range. ALGO price must produce stunning bullish action to void the bearish scenario.
Algorand price looks severely bearish
Algorand price confirmed last month’s bearish outlook as the blockchain token witnessed a 25% downswing. The bears pierced a 2020 liquidity level near $0.22 in the process and has remained submerged below the barrier. When zooming out, ALGO appears to be trading at the upper bounds of 2020’s range, which forecasts problematic bearish scenarios for the weeks to come.
Algorand price currently auctions at $0.189. Classical price action, which often uses Pareto’s 80/20 principle, would suggest that ALGO has an 80% chance to tag the other side of 2020’s trading range. The 2020 range low hovers at $0.099, which would be a disastrous 50% decline from Algorand’s current market value.
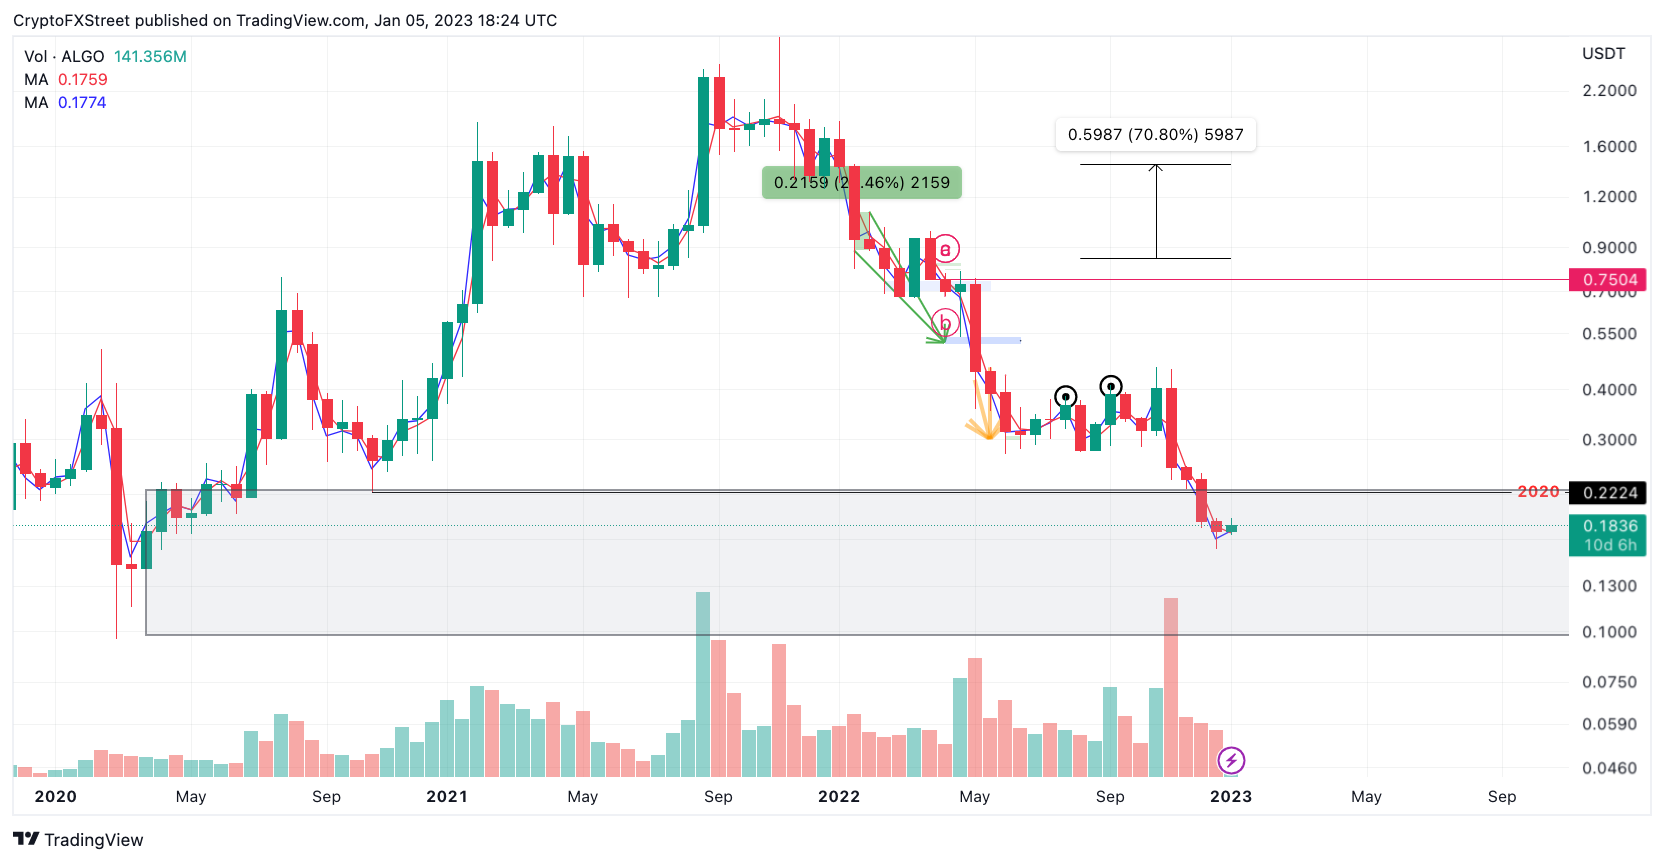
ALGO/USDT 2-week chart
Unfortunately, time will be a crucial factor in whether or not the Algorand price can alter the bearish narrative. A monthly candlestick close above the 2020 trading zone at $0.227 is needed to negate the potential 50% downswing move. A break above the invalidation zone would be a 25% increase from Algorand’s current trading price.
It is worth noting that the $0.099 barrier is also the all-time low. Attempting to buy a dip near the lows could still lead to severe losses as digital assets usually go into price discovery after breaching all-time lows and all-time highs. Thus, investors may want to remain sidelined until more evidence of a market reversal presents itself.
This video details how Bitcoin price moves could affect Algorand price
Author

Tony M.
FXStreet Contributor
Tony Montpeirous began investing in cryptocurrencies in 2017. His trading style incorporates Elliot Wave, Auction Market Theory, Fibonacci and price action as the cornerstone of his technical analysis.




