Why Cardano price floating around $0.30 is not a good look
- Cardano price witnessed a rejection from several barriers during the final weekend of November.
- ADA price has liquidity levels near $0.270 that have not been offered in the market since 2020.
- A daily candlestick close above the $0.319 resistance zone may spark a countertrend rally.

Cardano price is in a conflicting situation. While hopes for a Santa rally linger amongst crypto enthusiasts, ADA's monthly performance points to further negative returns. If the bulls do not soon pull off a stunning rebellion, Cardano price auctioning around $0.20 will be imminent.
Cardano price could be in trouble
Cardano price has the community watching closely as the price hovers a few ticks away from the newfound monthly low at $0.295. During the last weekend of November, the bulls failed several times to sustain support above the 8-day exponential moving average (EMA). During the New York session on Monday, November 28, the bears forged a firm rejection from the EMA. As the price hovers below the moving average, traders are forced to ask a pivotal question. What price are the bears truly aiming for?
Cardano price currently auctions at $0.306. The rejection from the 8-day EMA shows an uptick in transactions compared to the previous weekend. The rejection was simultaneously at a triangle apex that manifested earlier in the month. Elliott Wave practitioners utilize reactions of a triangle apex to gauge whether or not a trend will continue. In Cardano’s case, the bulls’ failure to produce a daily closing candlestick above the apex means the downtrend will likely continue.
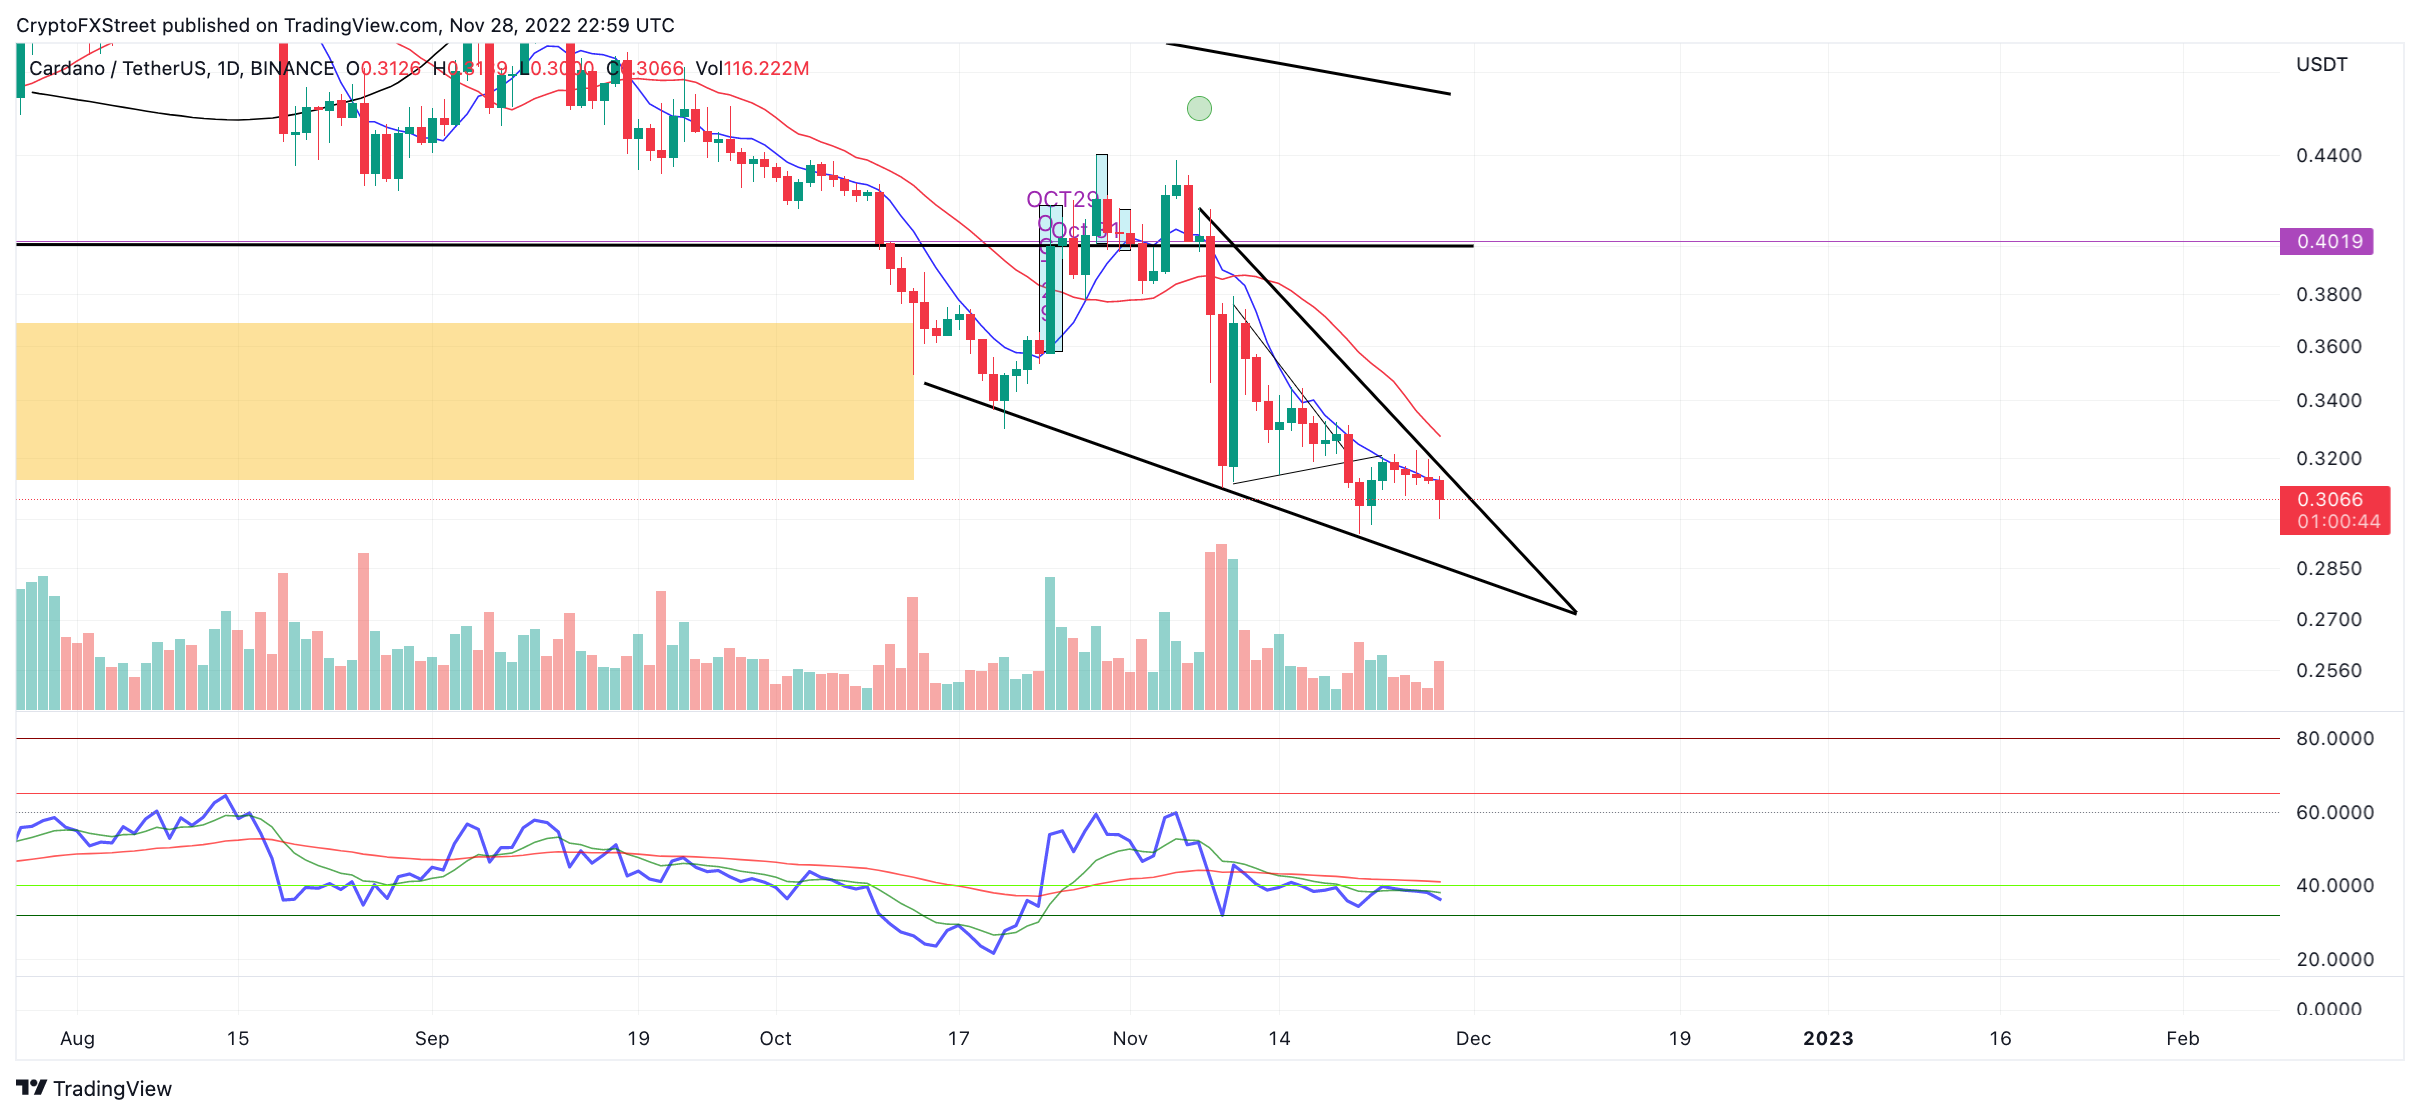
ADA/USDT 1-Day Chart
Considering these factors, the Cardano price may only be able to sustain support around the current price levels for a short period. If market conditions persist, the Cardano price will produce a bearish engulfing candlestick on the monthly time frame. For classical price action traders, the bearish gesture would be a clear exit from the market signal. A key level of interest would be the 2020 liquidity zone near $0.27.
The bulls will need to definitively settle above the triangle apex at $0.319 to justify a countertrend rally., If the scenario occurs, the bulls could prompt a countertrend spike into the upper bounds of the triangle's trading range near $0.355. The move would create a highly probable potential for a 16% countertrend rally in December.
Author

Tony M.
FXStreet Contributor
Tony Montpeirous began investing in cryptocurrencies in 2017. His trading style incorporates Elliot Wave, Auction Market Theory, Fibonacci and price action as the cornerstone of his technical analysis.


