Why a SafeMoon price break above $0.00000208 is vital to trigger a major recovery
- SafeMoon price is showing signs of recovery as it continues to record higher lows.
- The governing technical pattern projects a bullish target of a 55% ascent.
- Only a break above $0.00000208 could see SAFEMOON fulfill its optimistic outlook.

SafeMoon price has dropped to a new low following the Bitmart hack that witnessed over $200 million stolen from the crypto exchange. However, SAFEMOON appears to be gearing up for a massive move toward the upside as it nears a critical resistance level.
SafeMoon price eyes 55% ascent
SafeMoon price has formed a symmetrical triangle pattern on the 4-hour chart, as the token creates higher lows and lower highs. Following the local bottom reached on December 5 at $0.00000103, SAFEMOON is preparing for a major recovery, targeting a 55% upswing toward $0.00000321.
In order for the bullish outlook to be validated, SafeMoon price would need to slice above the upper boundary of the prevailing chart pattern at $0.00000208, coinciding with the 38.2% Fibonacci retracement level.
Investors should note that additional resistance may emerge for SafeMoon price at the 50 four-hour Simple Moving Average (SMA) at $0.00000241 corresponding to the 50% retracement level.
SafeMoon price would also face an obstacle at the 100 four-hour SMA at $0.00000274, which intersects with the 61.8% Fibonacci retracement level. Should buying pressure continue to increase, SAFEMOON may eventually reach its optimistic target at $0.00000321, coinciding with the 200 four-hour SMA.
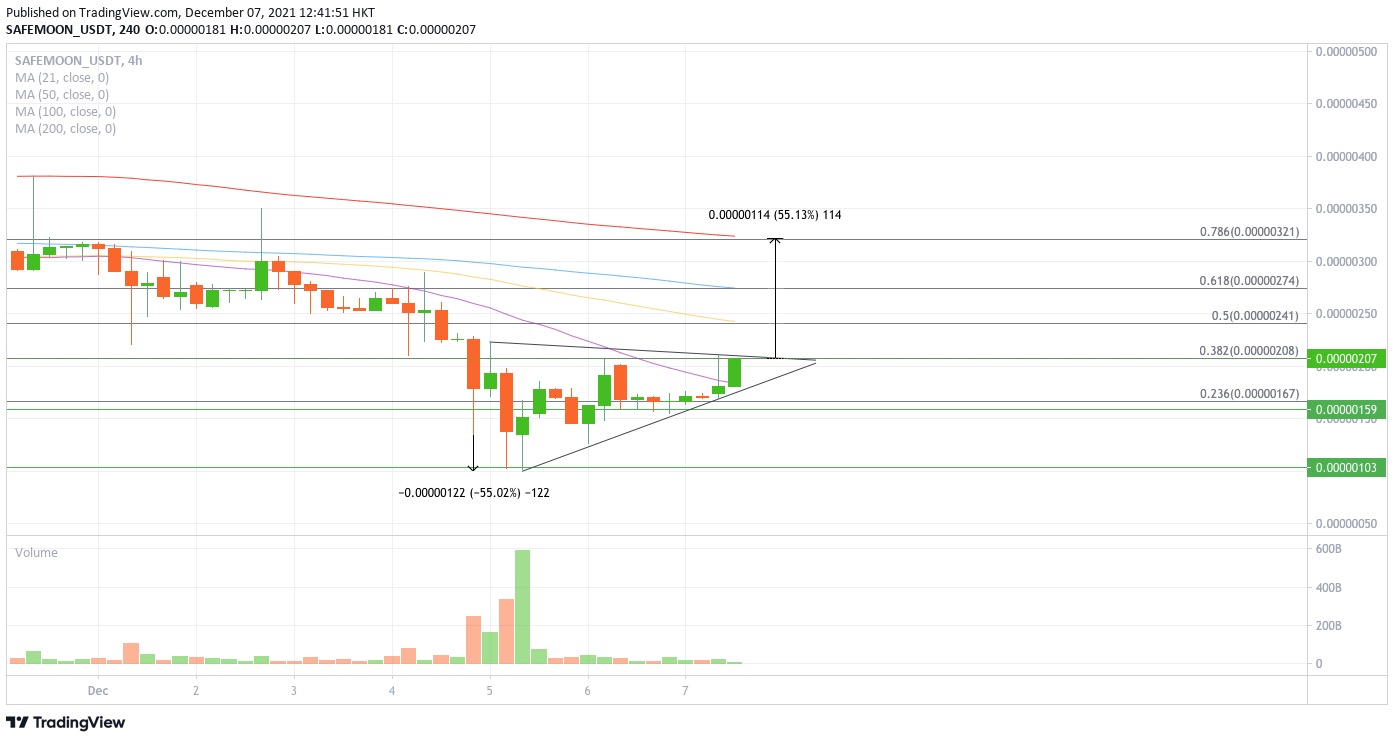
SAFEMOON/USDT 4-hour chart
However, if a spike in sell orders occurs, SafeMoon price may discover immediate support at the 21 four-hour SMA at $0.00000185. An additional line of defense will emerge at the lower boundary of the symmetrical triangle at $0.00000176.
If SafeMoon price slides below the aforementioned support level, this could trigger a sell-off that could see SAFEMOON at risk of sliding lower. However, the token would find additional foothold at the October 8 low at $0.00000159, then at the September 9 low at $0.00000103.
Author

Sarah Tran
Independent Analyst
Sarah has closely followed the growth of blockchain technology and its adoption since 2016.


