Where to exit Ethereum before it crashes to $1,700
- Ethereum price bounces off the $2,200 support level after a 12% crash over the last three days.
- Investors can expect a retest of $2,541 before ETH crashes to $1,730 to collect the sell-stop liquidity.
- A three-day candlestick close above $3,079 will invalidate the bearish thesis by producing a higher high.

Ethereum price has sealed its bearish fate after breaching the consolidation pattern’s lower trend line on May 6. This development has worsened the situation and caused a steep correction for ETH.
Ethereum price provides an opportunity
Ethereum price set three distinctive higher lows and two higher highs since the January 22 crash. Connecting the swing points using trend lines reveals an ascending parallel channel. This technical formation ideally results in a bearish breakout
On May 6, Ethereum price breached the ascending parallel channel’s lower trend line, indicating a breakout. This downswing move caught traction and led to an 18% drop in ETH price in less than a week.
At the time of writing, Ethereum price is trading around the $2,199 support level, where buyers seem to be scooping ETH up at a discount. However, considering where Bitcoin price stands, further downside seems more likely.
Hence, investors need to be cautious and smart in buying the dips. There might, however, be a minor uptick in buying pressure that could push Ethereum price up to the $2,541 hurdle. This level is likely where the upside is capped for ETH before sellers take control.
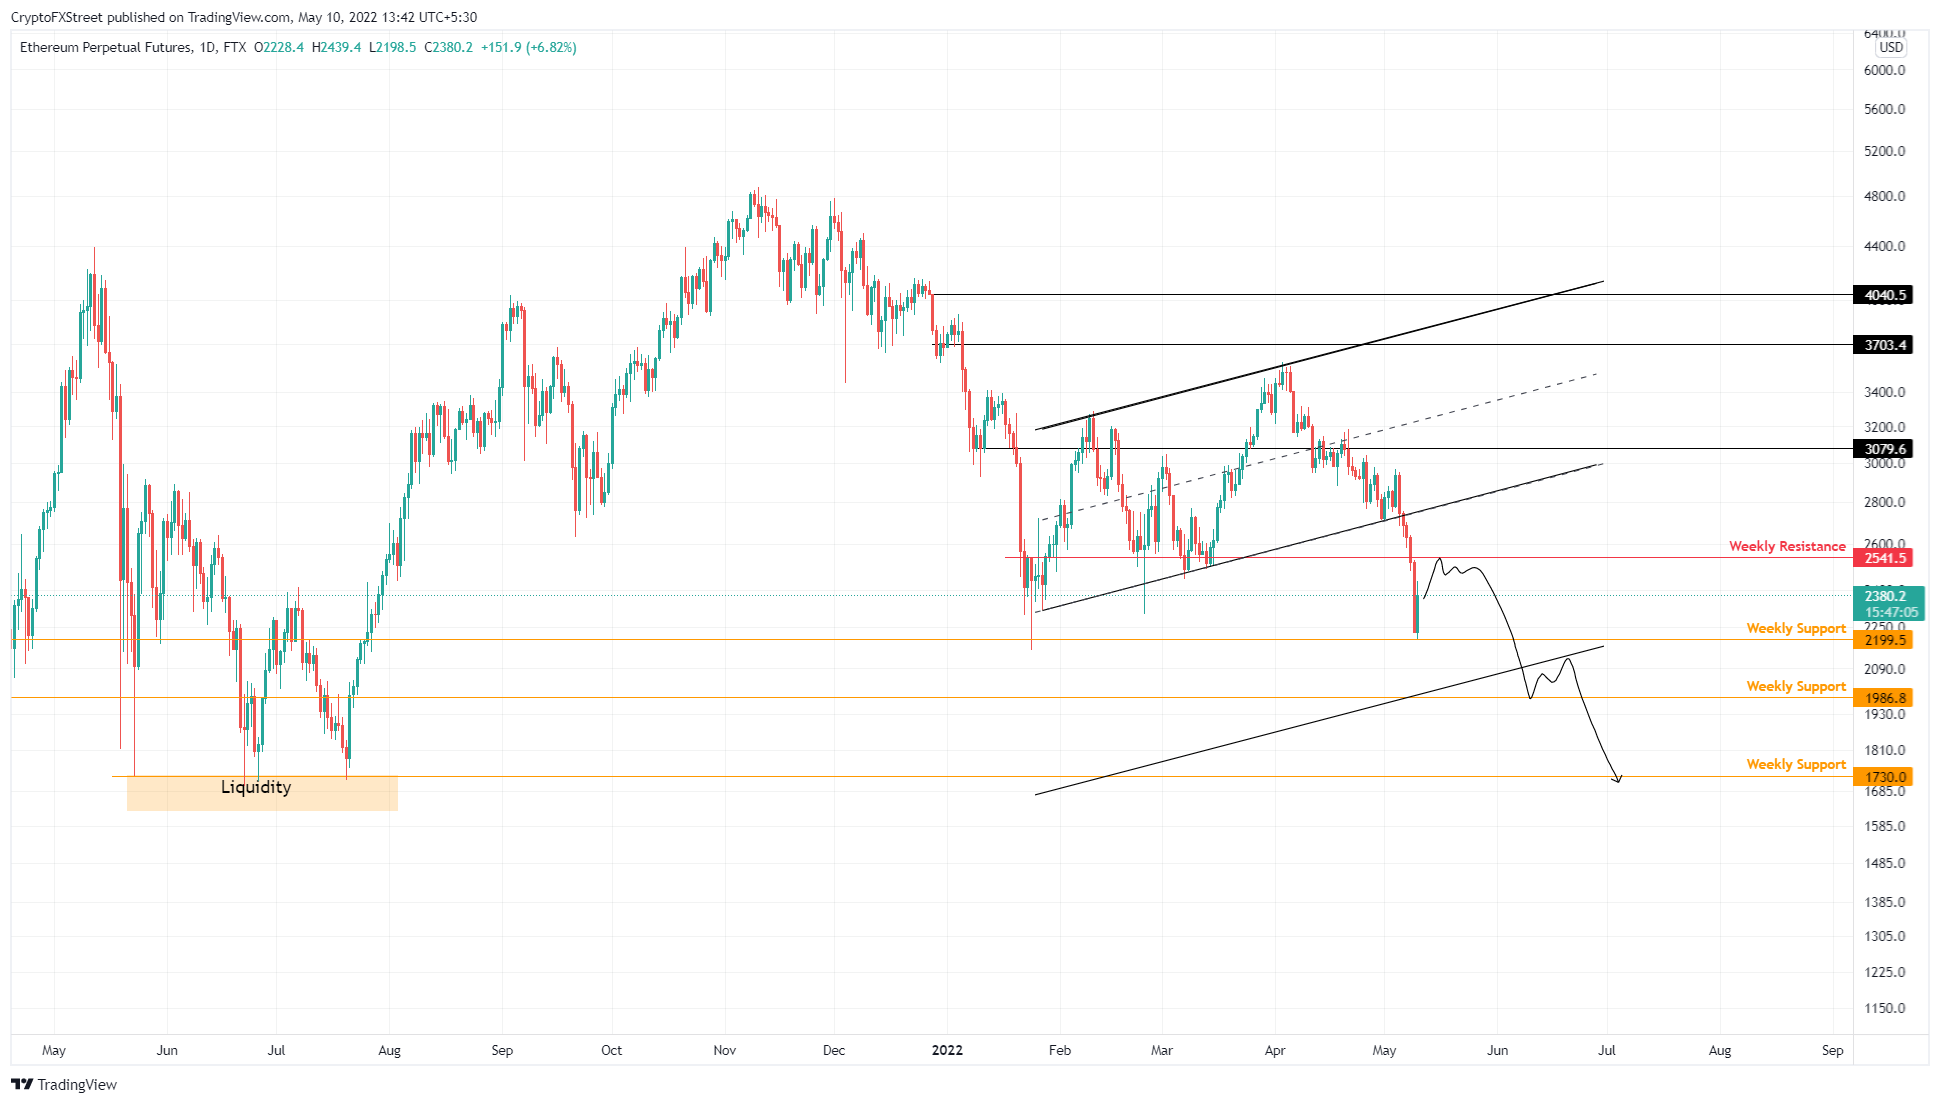
ETH/USDT 1-day chart
Supporting this downswing in Ethereum price is the 30-day intraday Market Value to Realized Value (MVRV). This on-chain metric is used to determine the average profit/loss of investors that purchased ETH over the past month.
Based on Santiment’s research, a value ranging from -10% to -15% is termed an “opportunity zone,” since the short-term holders are at a loss and are less likely to sell. However, for ETH, the local base was formed around -16%, which is where the MVRV is currently at and also explains the recent uptick in buying pressure.
However, there is another potential base around -30%, where ETH stabilized after crashes in May 2021 and January 2022.
Therefore, the chances of Ethereum price heading to $1,730 are high as portrayed by the MVRV 30-day chart.
 [10.01.30, 10 May, 2022]-637877689578542271.png)
ETH 30-day MVRV intraday
Further worsening the situation for bulls is the supply distribution seen across whales holding between 100,000 to 10 million ETH.
The first set of wallets – those holding between 100,000 and 1,000,000 ETH – has dropped from 1,452 to 135 over the past three months. For the other group, these numbers have dipped from eight to five.
The generalized decline in institutions holding Ethereum indicates that they are not confident in the performance of ETH price in the near future.
 [10.02.36, 10 May, 2022]-637877689553140853.png)
ETH supply distribution
Driving the bearish thesis home is the recent uptick in the supply of ETH on exchanges from 14.86 million to 15.37 million since April 20.
This 3.4% surge indicates that investors are moving their tokens to centralized platforms to potentially sell and also adds credence to the outlook described in the supply distribution chart above.
 [09.58.35, 10 May, 2022]-637877689270655646.png)
ETH supply on exchanges
While the bearish outlook seems plausible, a spike in bullish momentum could alleviate the sell-side pressure. However, a three-day candlestick close above $3,079 will invalidate the bearish thesis by recovering its losses. In such a case, Ethereum price could further rally to $3,703 and set a higher high, confirming the start of an uptrend.
Author

Akash Girimath
FXStreet
Akash Girimath is a Mechanical Engineer interested in the chaos of the financial markets. Trying to make sense of this convoluted yet fascinating space, he switched his engineering job to become a crypto reporter and analyst.