- LUNA Classic price declined by 17% in the last two weeks to trade at $0.000170
- All price indicators suggest a bearish outlook for LUNC which could result in a 25% decline in price.
- A daily candlestick close above $0.000189 would invalidate the bearish outlook for the altcoin.
LUNA Classic price fared well until two weeks ago, as the altcoin had noted a 55% increase in value over the month. But the changing market conditions might push LUNC and many other cryptocurrencies into the bears' hands.
LUNA Classic price charts red candles
LUNA Classic slipped by more than 20% over the last ten days to fall from $0.000200 to trade at $0.000170. After marking a six-month high, the altcoin fell back to tag the immediate support level at $0.000157. This decline in price was the result of the market cooling down following the rally, which might extend if the bears dominate the momentum.
The Moving Average Convergence Divergence (MACD) indicator highlights bearish sentiment building up. As per the indicator, the LUNA Classic price underwent a bearish crossover nearly a week ago when the indicator line (blue) moved under the signal line (red).
A similar observation can also be made on the Relative Strength Index (RSI), which fell below the neutral mark of 50.0 into the bearish zone.
An excessive drawdown in prices might be out of the question for LUNC, however, as it is still far away from the deep bearish zone around the oversold region below 30.0.
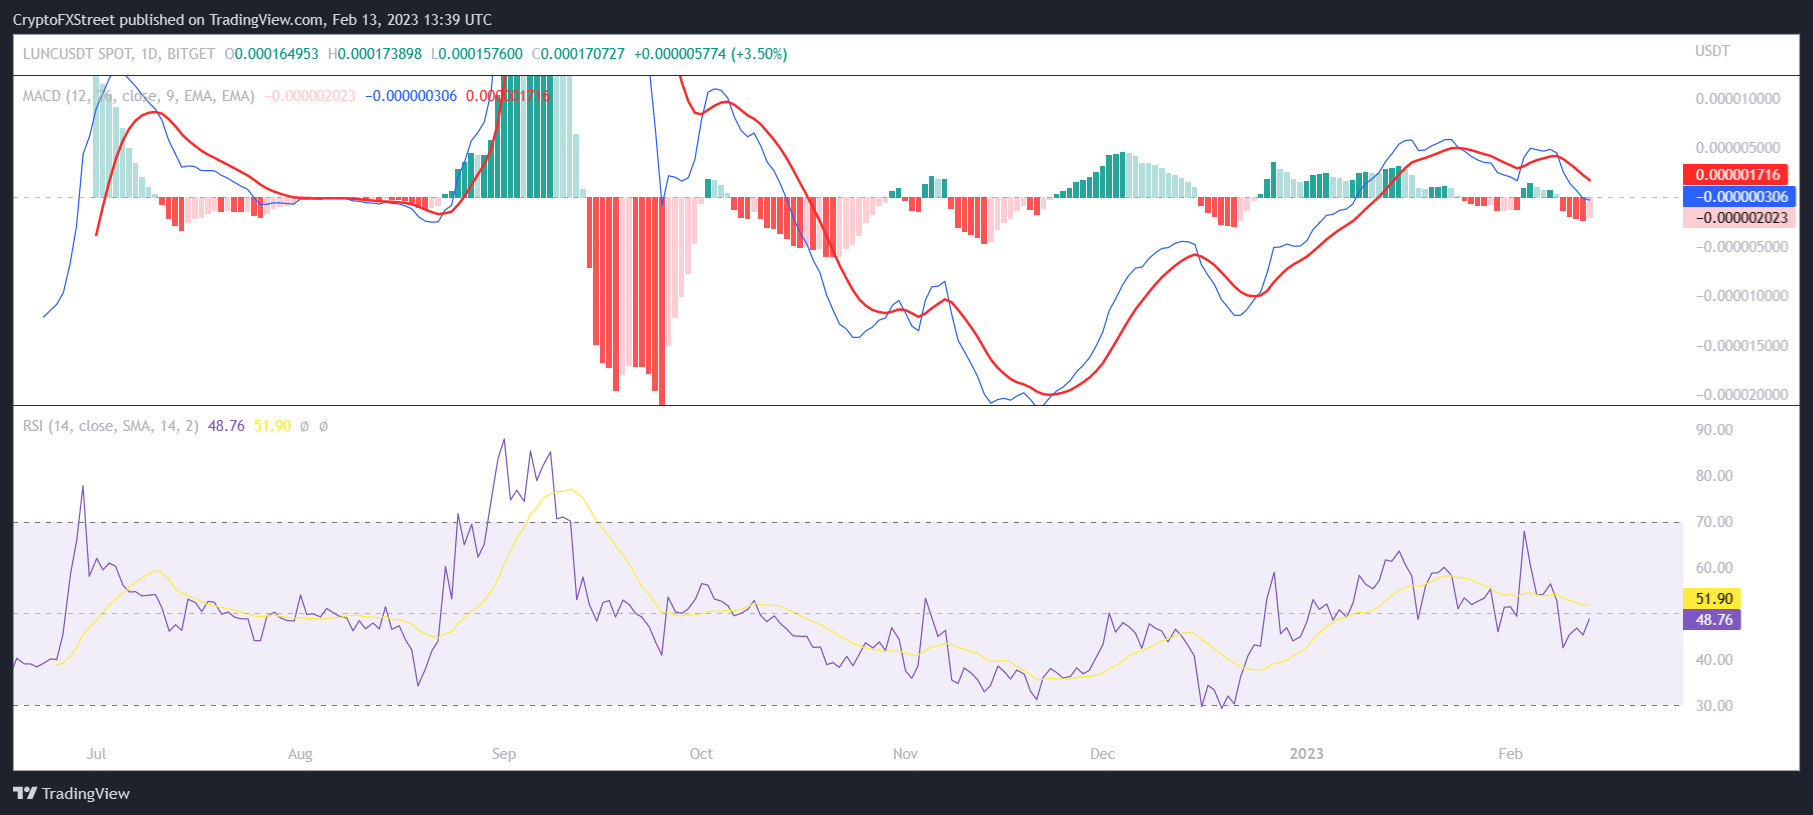
LUNC MACD and RSI
If LUNA Classic price follows these signs and selling supersedes buying, the altcoin could end up tagging the immediate support level at $0.000157. Falling through this line would bring LUNC to the year-to-date lows of $0.000128, marking a 25% decline in value. Losing that support level would push the price below the $0.000120 mark.
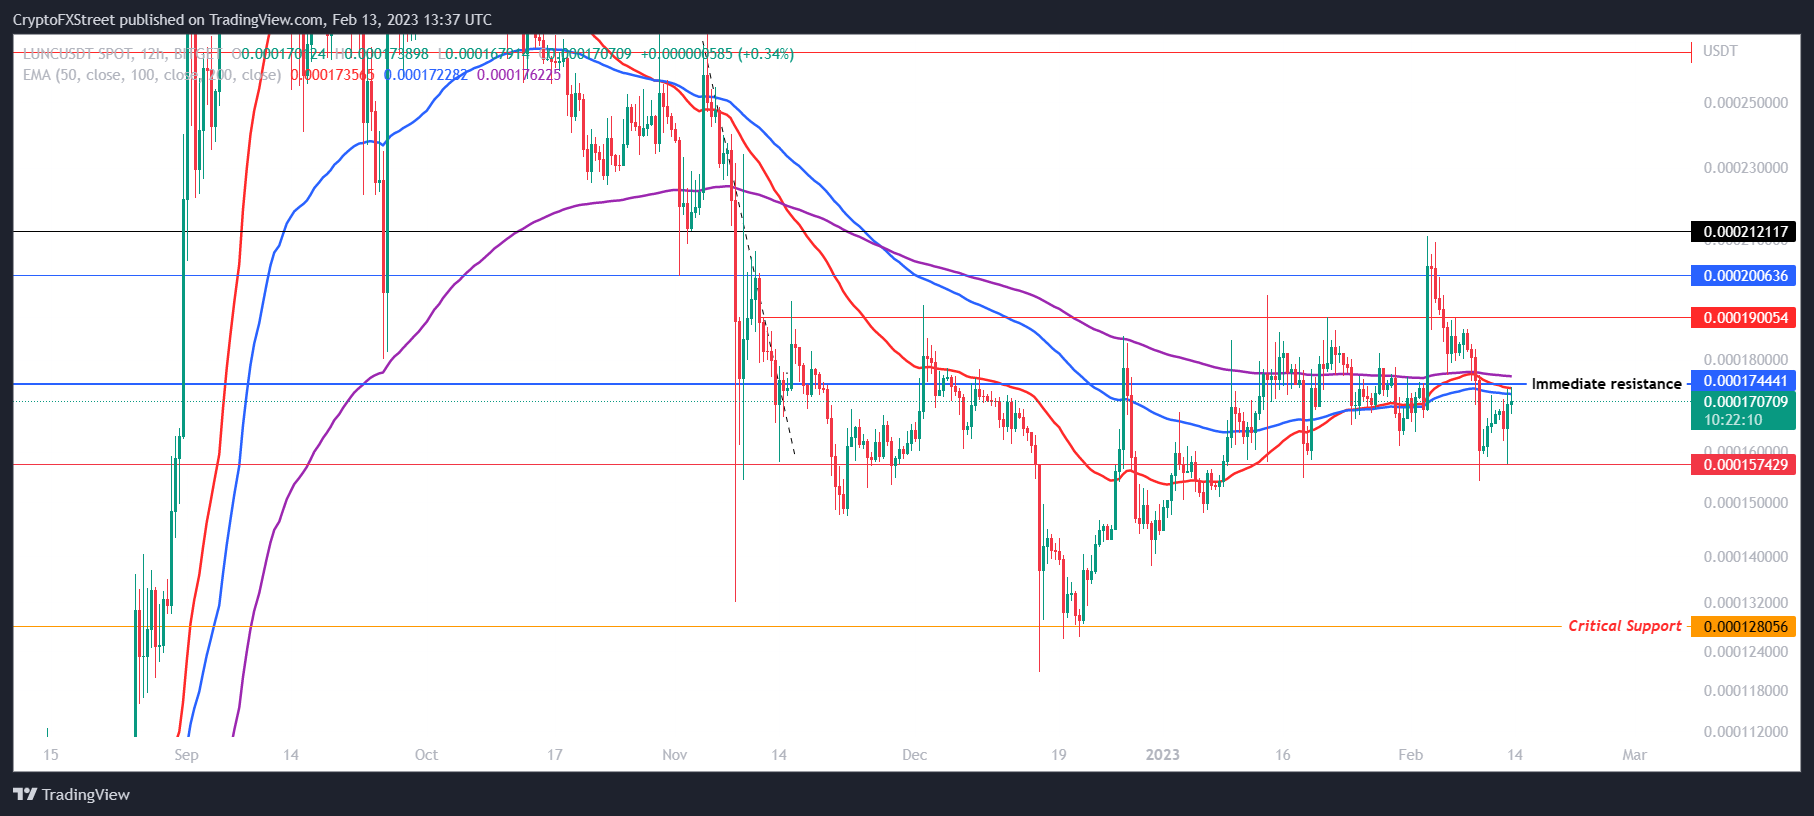
LUNC/USDT 12-hour chart
However, if buyers pull through and push the price above the immediate resistance of $0.000174, it would flip the 50, 100 and 200-day Exponential Moving Averages (EMA) into support. Bouncing off of this support would bring the price up to tag $0.000190, and a daily candlestick close above it would invalidate the bearish outlook. Flipping it into support would bring LUNA Classic price near the six-month high of $0.000200.
Information on these pages contains forward-looking statements that involve risks and uncertainties. Markets and instruments profiled on this page are for informational purposes only and should not in any way come across as a recommendation to buy or sell in these assets. You should do your own thorough research before making any investment decisions. FXStreet does not in any way guarantee that this information is free from mistakes, errors, or material misstatements. It also does not guarantee that this information is of a timely nature. Investing in Open Markets involves a great deal of risk, including the loss of all or a portion of your investment, as well as emotional distress. All risks, losses and costs associated with investing, including total loss of principal, are your responsibility. The views and opinions expressed in this article are those of the authors and do not necessarily reflect the official policy or position of FXStreet nor its advertisers. The author will not be held responsible for information that is found at the end of links posted on this page.
If not otherwise explicitly mentioned in the body of the article, at the time of writing, the author has no position in any stock mentioned in this article and no business relationship with any company mentioned. The author has not received compensation for writing this article, other than from FXStreet.
FXStreet and the author do not provide personalized recommendations. The author makes no representations as to the accuracy, completeness, or suitability of this information. FXStreet and the author will not be liable for any errors, omissions or any losses, injuries or damages arising from this information and its display or use. Errors and omissions excepted.
The author and FXStreet are not registered investment advisors and nothing in this article is intended to be investment advice.
Recommended Content
Editors’ Picks

Bitcoin Weekly Forecast: BTC shows weakness, bears aiming for $90,000 mark
Bitcoin (BTC) price hovers around $97,000 on Friday after losing nearly 5% in the last three days. CryptoQuant weekly report shows that activity on the Bitcoin network has declined to its lowest level in a year.

ONDO Price Forecast: Ondo Chain launched while TVL rises to $654 million
Ondo price is nearing its key weekly resistance of $1.38 on Friday, and a firm close above this level hints at a rally ahead. Ondo launches its Ondo Chain, a new Layer 1 blockchain purpose-built for institutional-grade RWAs.

Top 3 Price Prediction Bitcoin, Ethereum, Ripple: BTC, ETH and XRP are at risk of for further declines
Bitcoin (BTC) hovers around $97,400 on Friday after losing nearly 5% in the last three days. Ethereum (ETH) and Ripple (XRP) fail to recover and face rejection from their key levels, hinting at further corrections.

XRP ETF gains traction as SEC acknowledges Grayscale filing for Solana and Litecoin funds
Ripple's XRP was in the limelight on Thursday following the Chicago Board Options Exchange (Cboe) 19b-4 filing to the SEC to list and begin trading XRP exchange-traded funds (ETFs) for asset managers Canary Capital, WisdomTree, 21Shares and Bitwise.

Bitcoin: BTC shows weakness, bears aiming for $90,000 mark
Bitcoin (BTC) price hovers around $97,000 on Friday after losing nearly 5% in the last three days. CryptoQuant weekly report shows that activity on the Bitcoin network has declined to its lowest level in a year. Traders should watch FTX's upcoming repayments to creditors starting on February 18, which could bring in volatility for Bitcoin prices.

The Best Brokers of the Year
SPONSORED Explore top-quality choices worldwide and locally. Compare key features like spreads, leverage, and platforms. Find the right broker for your needs, whether trading CFDs, Forex pairs like EUR/USD, or commodities like Gold.