Waves Technical Analysis: WAVES rally $10 continues despite multiple sell signals
- Waves uptrend remains intact after ignoring several sell signals on the 12-hour and daily charts.
- WAVES/USD is required to close the day above the resistance at $8.8 - $9 to confirm the breakout to $10.

Waves has rallied by 1,410 % since the Black Thursday crash experienced in March after the Coronavirus pandemic broke globally. The bullish momentum hit $4.8 in August, but buyers took over control in October. WAVES will likely continue spiking to levels above $10 in the coming sessions.
Waves eyes $10 as bulls hold firmly
At the time of writing, WAVES is trading at $8.4 amid a growing bullish grip. The Relative Strength Index on the daily chart has reinforced the bullish outlook, resuming the overbought region's uptrend. On the other hand, volatility is on the rise, thus the higher potential for the price to hit highs above $10.
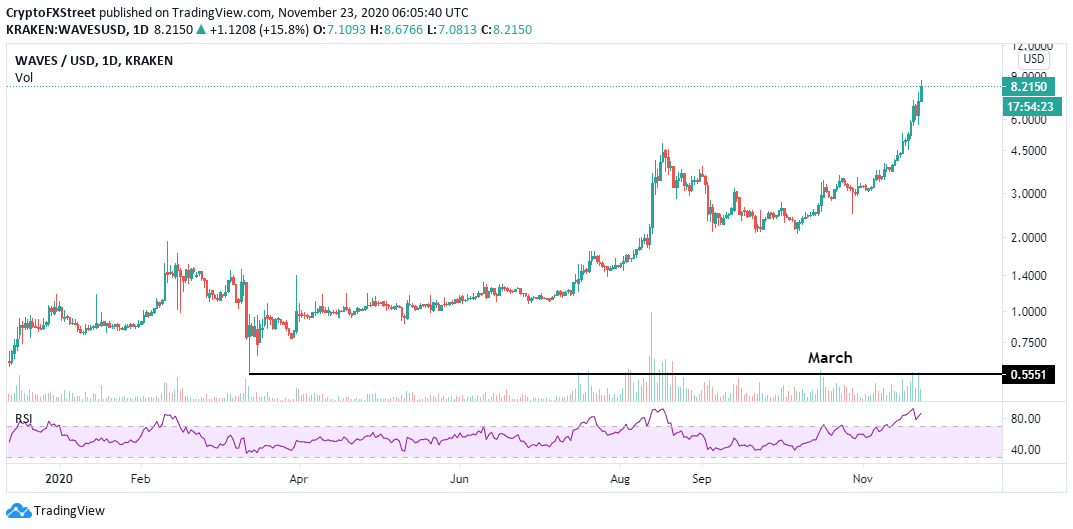
WAVES/USD daily chart
Over the last few weeks, the TD Sequential Indicator has presented multiple sell signals, especially on the 12-hour and daily charts, but most of them have been invalidated. The signals manifested green nine candlesticks. However, WAVES continued with the rally that currently eyes $10.
The most recent sell signal has been observed on the daily chart. However, with the RSI still moving upwards within the oversold territory, Waves may spike past $9 and confirm the remaining leg to $10.
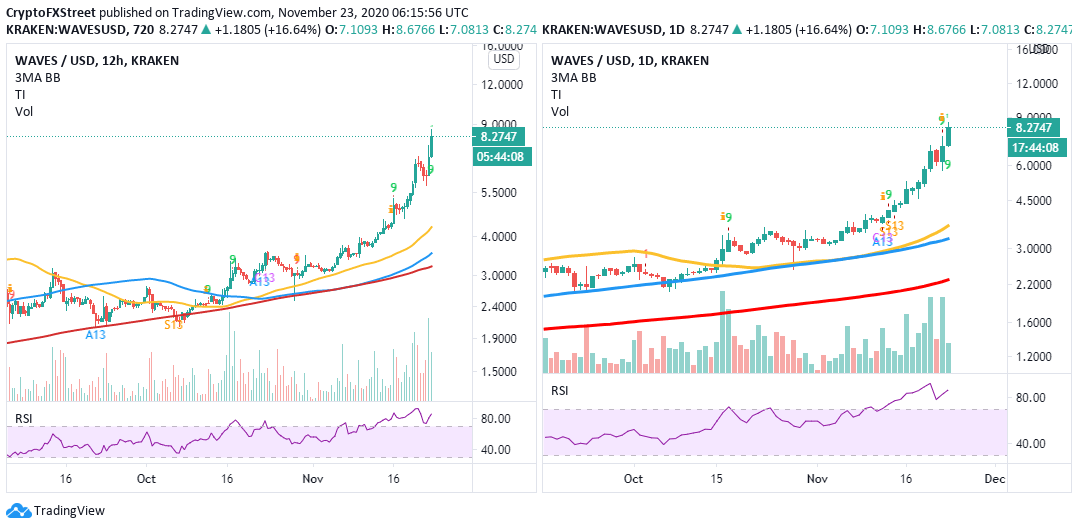
WAVES/USD 12-hour and daily charts
The immediate resistance holds at $8.8 - $9 and is likely to delay to breakout to $10. On the flip side, if the selling pressure intensifies under this zone and Waves is uptrend is rejected, a downward price may occur.
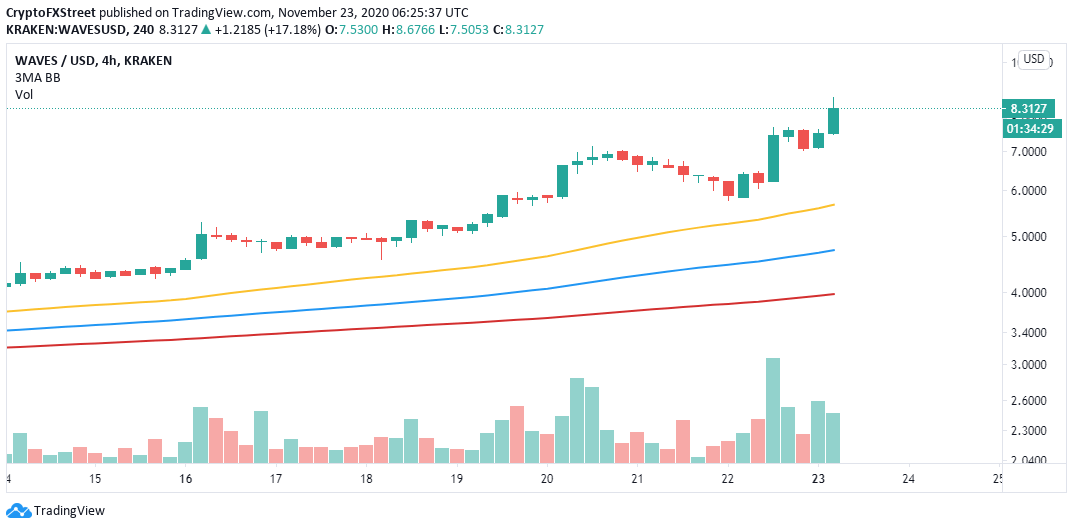
WAVES 4-hour chart
From the chart, the first point of contact in the event of a correction would be $7. If WAVES overshoots this initial support, the next support target holds the ground at the 100 Simple Moving Average. Similarly, other essential support areas to keep in mind are the 50 SMA at $5 and 200 SMA at $4.
Author

John Isige
FXStreet
John Isige is a seasoned cryptocurrency journalist and markets analyst committed to delivering high-quality, actionable insights tailored to traders, investors, and crypto enthusiasts. He enjoys deep dives into emerging Web3 tren


