VET/USD Elliott Wave technical analysis [Video]
![VET/USD Elliott Wave technical analysis [Video]](https://editorial.fxsstatic.com/images/i/crypto-01.jpg)
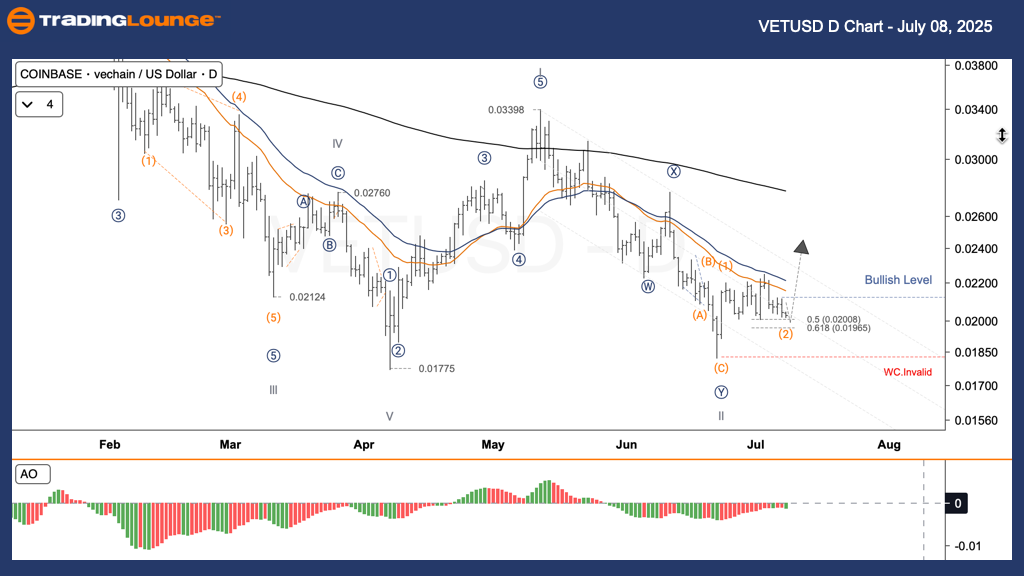
VETUSD Elliott Wave technical analysis
-
Function: Follow-trend.
-
Mode: Motive.
-
Structure: Impulse.
-
Position: Wave 2.
-
Next higher degrees direction: Uptrend.
-
Wave cancel invalid level: 0.01780.
VETUSD trading strategy
After rebounding from the lows near $0.017, VeChain (VETUSD) is forming an Impulse wave. Wave (1) is now completed, and the market is consolidating in wave (2).
Trading strategies
-
Short-term traders (Swing trade).
Look for reversal signs in the $0.20 – $0.19 zone to potentially enter the upward trend. -
Structure null point: 0.01780 (Wave Count Invalid).
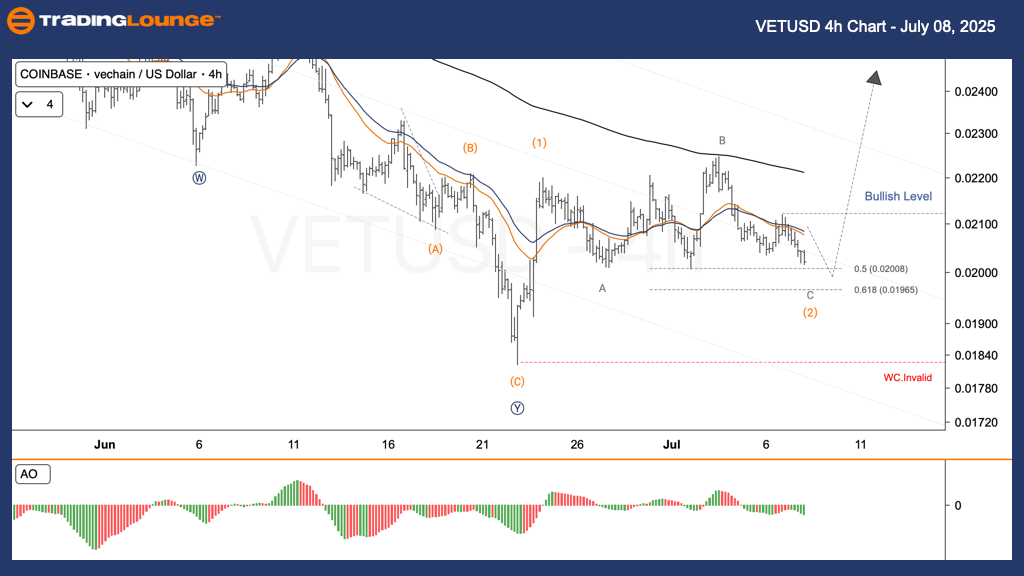
VETUSD Elliott Wave technical analysis
-
Function: Follow-trend.
-
Mode: Motive.
-
Structure: Impulse.
-
Position: Wave 2.
-
Next higher degrees direction: Uptrend.
-
Wave cancel invalid level: 0.01780.
VETUSD trading strategy
The price recovery from $0.017 shows early signs of an Impulse wave structure. Wave (1) appears completed. Currently, wave (2) is forming, and traders can watch for bullish reversal patterns.
Trading strategies
-
Swing Traders:
Entry opportunities may arise in the $0.20 – $0.19 range upon confirmation of a reversal. -
Invalidation level: 0.01780.
VETUSD Elliott Wave technical analysis [Video]
Author

Peter Mathers
TradingLounge
Peter Mathers started actively trading in 1982. He began his career at Hoei and Shoin, a Japanese futures trading company.


