VeChain Price Prediction: VET is breaking out, bulls target 40% upswing
- VeChain is in the initial stages of a massive upswing that could brush shoulders with $0.044.
- The IOMAP chart shows no formidable overhead pressure, while robust support has been confirmed between $0.025 and $0.027.

VeChain seems ready for takeoff if the uptrend manages to overcome one of the critical resistance levels. Meanwhile, buyers are working tooth and nail to avert possible losses, which may come into the picture before the expected breakout to $0.044.
VeChain technicals become stronger ahead of upswing
At the time of writing, VET/USD is doddering at $0.03 after stalling at the x-axis of the ascending triangle pattern. The pattern is interpreted as extremely bullish in technical analysis. It is formed by connecting an asset’s peaks with a horizontal line while a trendline connects the higher lows.
A breakout is usually expected to come into the picture before the trendlines converge. Ascending triangle breakouts have a precise target measured between the highest and lowest points of the pattern. The distance is then applied to the breakout point and extrapolated to get the price target.
The Moving Average Convergence Divergence (MACD) appears to be aligning in favor of the uptrend. Note that this technical indicator tends to follow the path of a trend and calculates its momentum.
At the moment, it appears to be turning bullish, with the 12-day exponential moving average has crossed above the 26-day exponential moving average. It means that the odds for a bullish impulse have increased significantly.
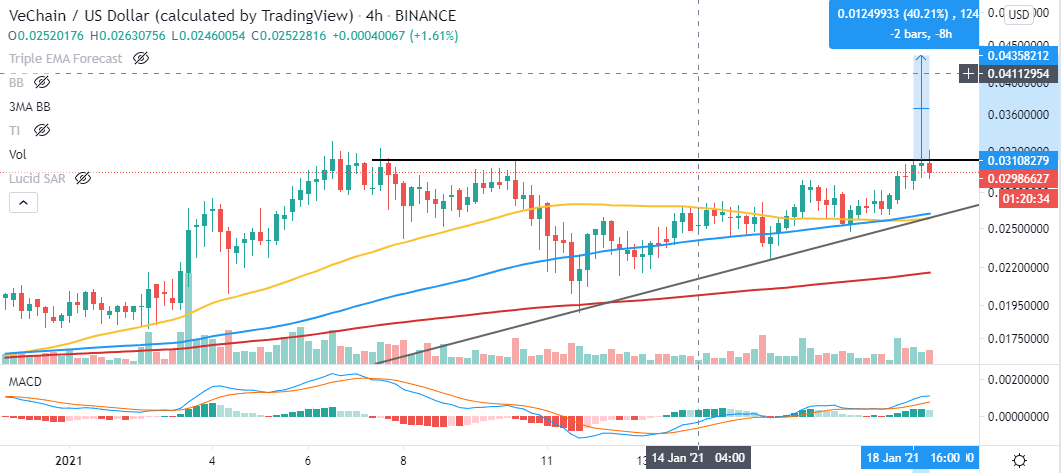
VET/USD 4-hour chart
The IOMAP model by IntoTheBlock reveals that there is little to no resistance that could prevent VeChain from achieving its potential. However, some attention must be channeled to the hurdle highlighted between $0.033 and $0.035. Here, one address bought 72 VET and may delay the breakout but once broken, the price may well rally to $0.044.
On the downside, VeChain seems to be sitting on an area with immense support, running from $$0.025 to $0.027. Here, 519 addresses are profiting from nearly 1.9 million VET bought in the price range.
-637466222275610141.png)
VeChain IOMAP chart
It is worth keeping in mind that VET might be forced to retreat some more, perhaps retest support at the 50 Simple Moving Average before breaking out at the x-axis. The IOMAP model has also confirmed the same support. Therefore, a retreat to the level should not be cause for alarm or panic selling.
Author

John Isige
FXStreet
John Isige is a seasoned cryptocurrency journalist and markets analyst committed to delivering high-quality, actionable insights tailored to traders, investors, and crypto enthusiasts. He enjoys deep dives into emerging Web3 tren




