VeChain Pirce Prediction: A key level stands between VET’s completion of 130% bull rally
- Vechain price has been on a tear, surging 100% in under 11 days.
- Momentum reversal indicator’s (MRI) breakout level stands between VeChain’s last leg-up.
- A correction will come into the picture if the demand barrier at $0.061 is taken down.

VeChain price shows an overwhelming bullish momentum that pushed it by more than 100% in under two weeks. Now, VET could surge another 13% if a critical level is breached.
VeChain price poised to move higher
VeChain price has been trending in an ascending parallel channel for a little over two months. This pattern’s trendlines have contained VET’s upswings and downswings, forming higher highs and higher lows.
After hitting a local bottom on February 28, VeChain price initiated a 130% bull run to $0.083 that is still underway. At the time of writing, VET needs another 13% to hit this target, but a critical barrier stands between this run-up.
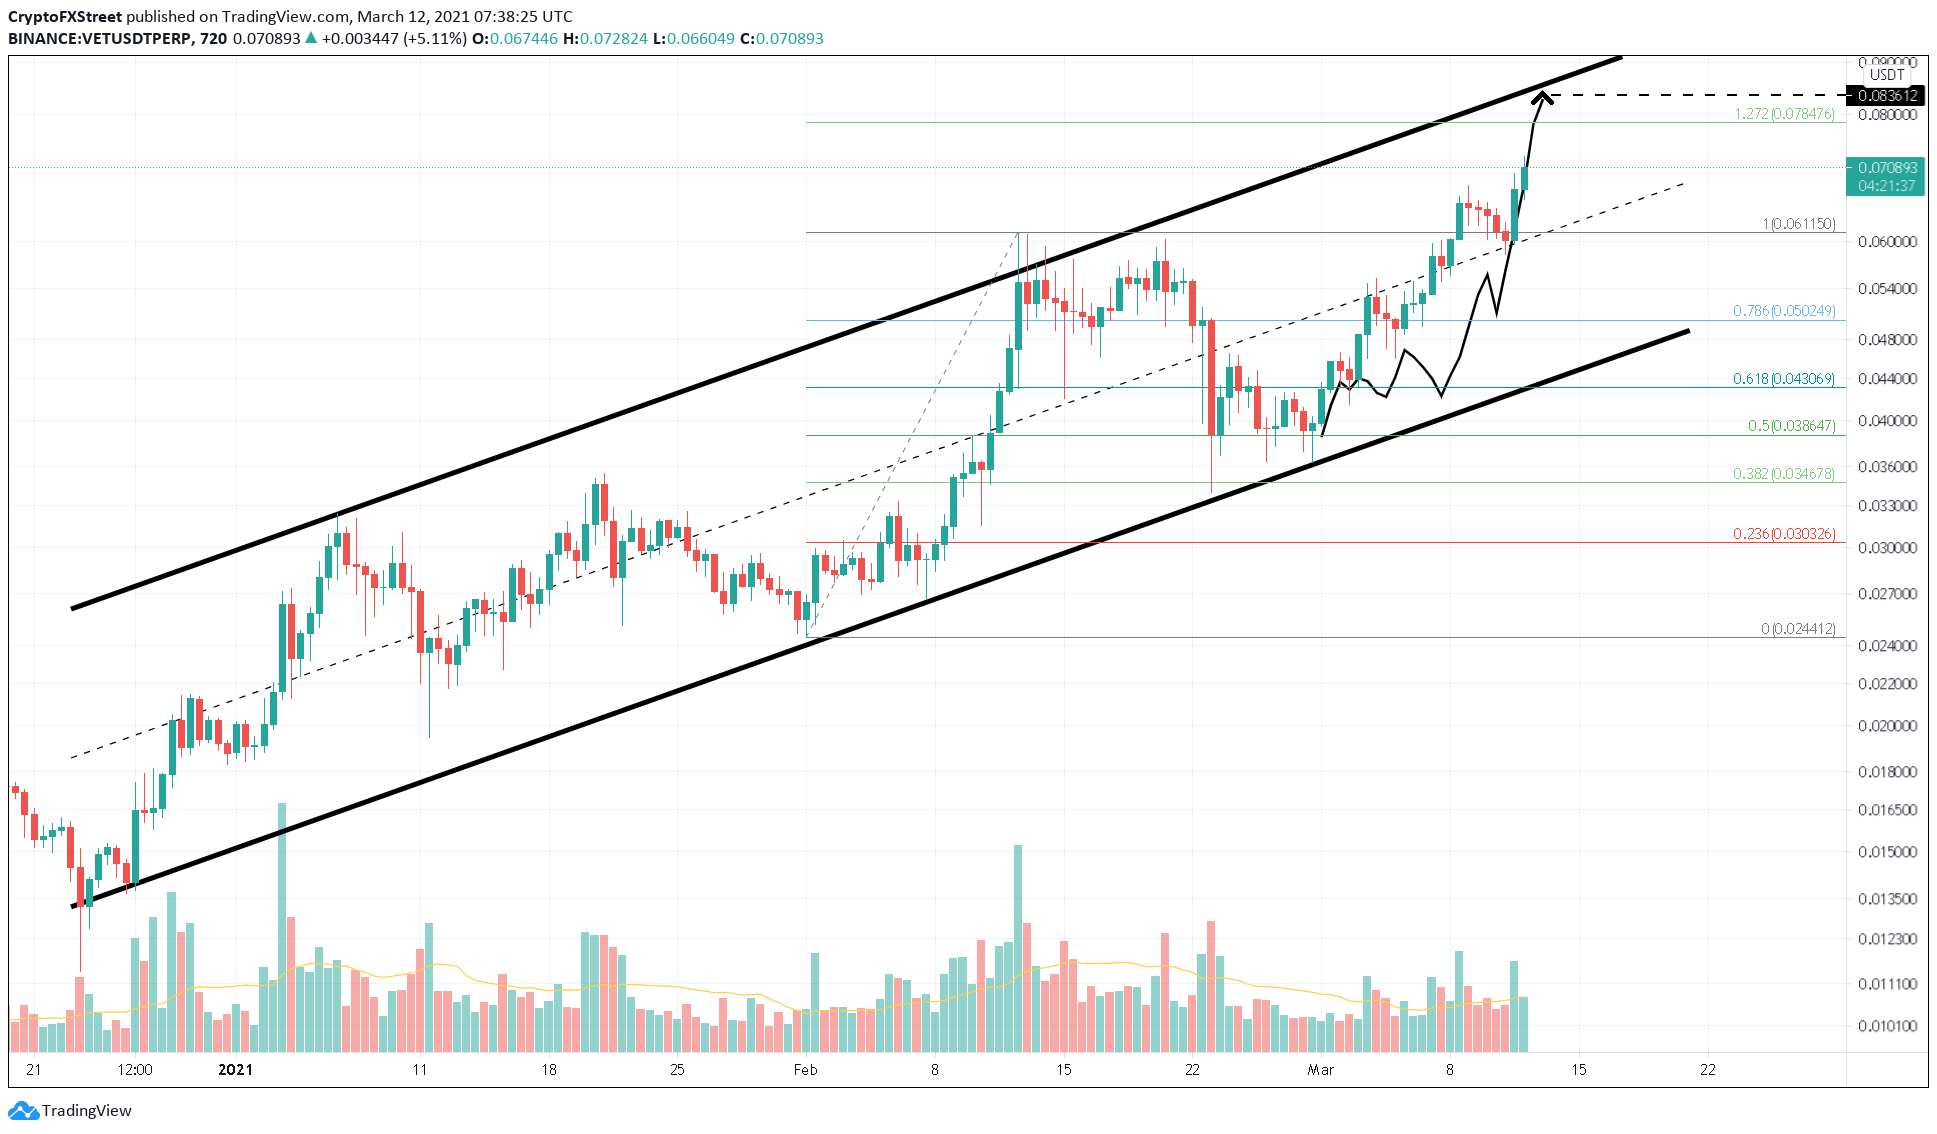
VET/USDT 12-hour chart
According to MRI, a breakout level has formed at $0.073. If breached, VET will continue its uptrend, as even the technical signs hint at a bullish conclusion.
For example, the Parabolic SAR indicator has developed below the price action indicating a bullish bias. The same can be said for the SuperTrend indicator that flashed a buy signal recently.
A continuation of the buying pressure seen thus far that result in a 12-hour candlestick close above the breakout level at $0.073 will trigger a 13% upswing to the target at $0.083
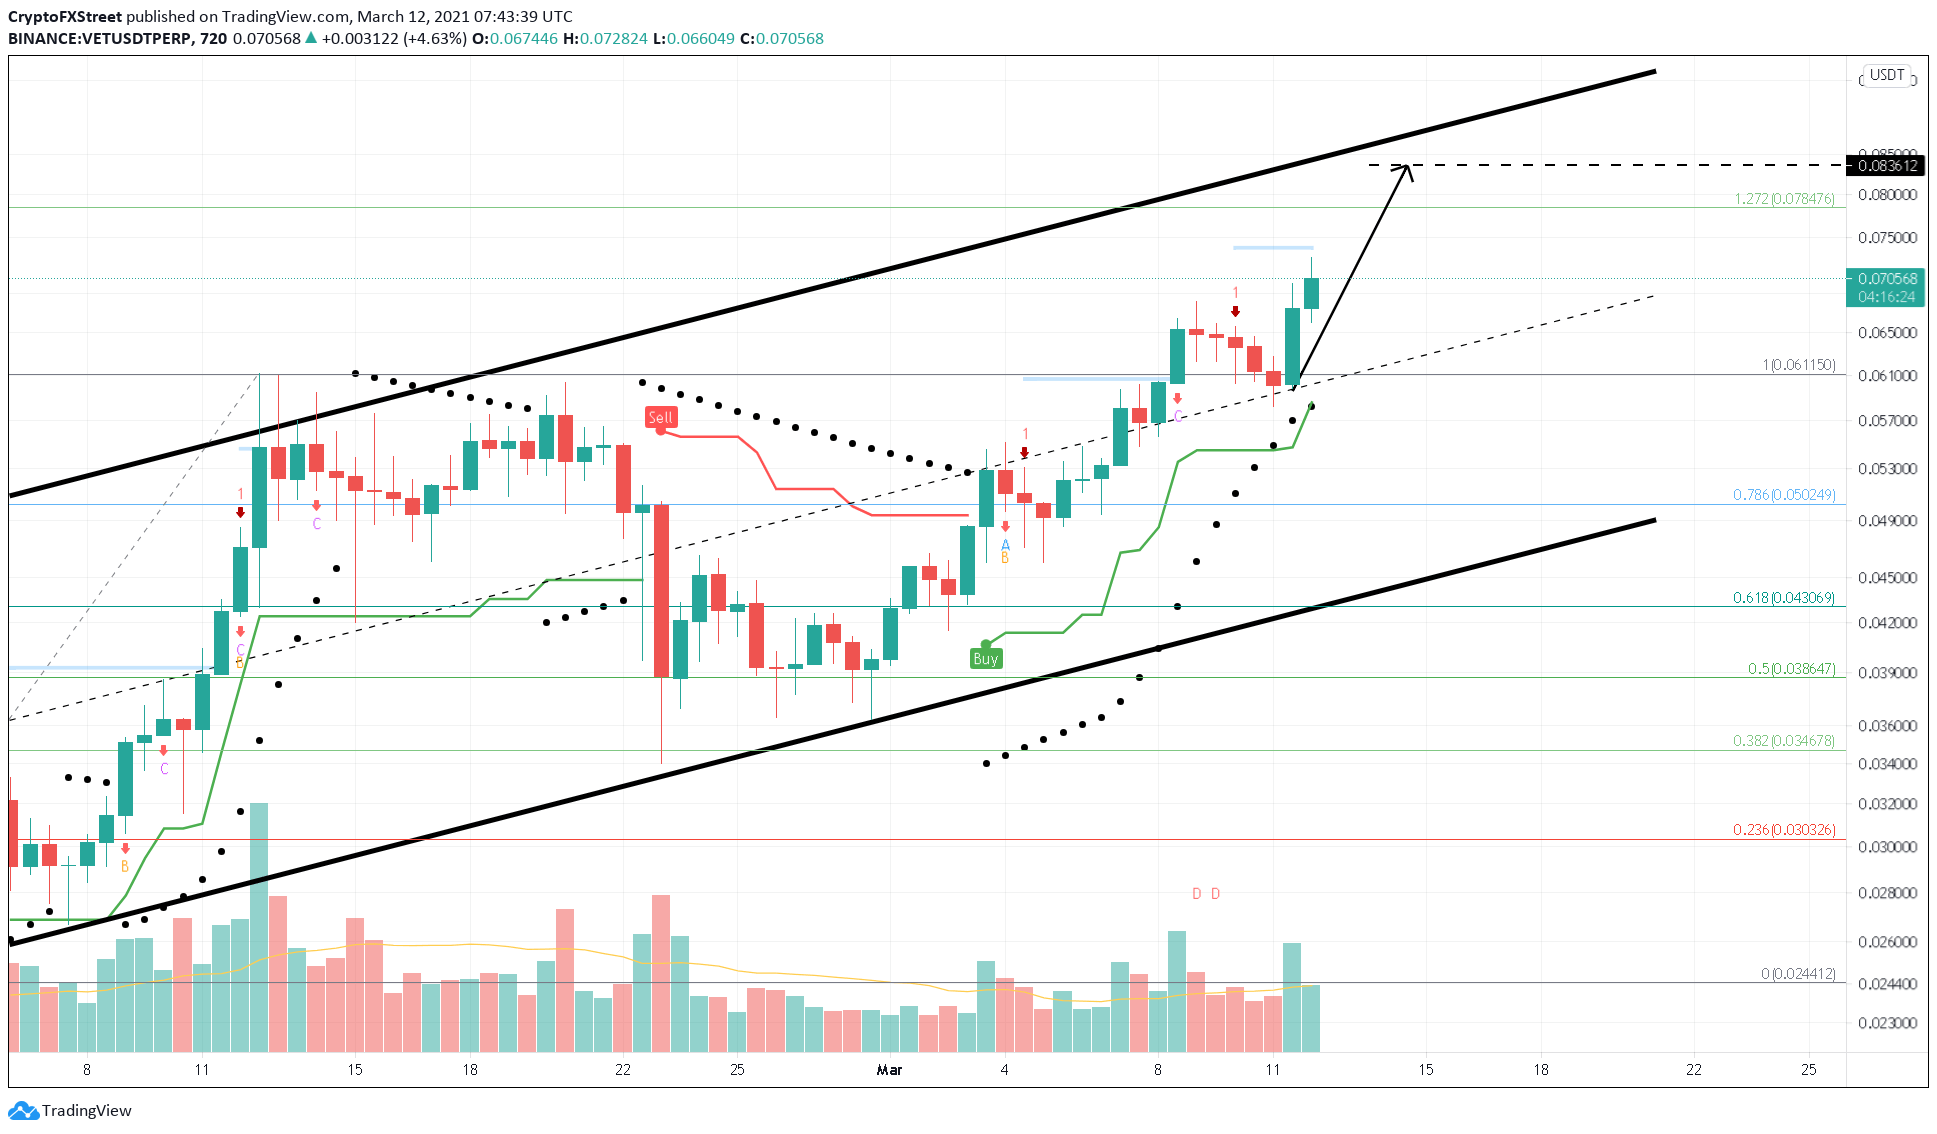
VET/USDT 12-hour chart
On the other hand, investors need to note that the bull rally for Vechain price is dependent on the breach o the MRI’s breakout level. A failure to rise past this barrier will result in a one-to-four candlestick correction.
However, if VET bears slice through the 100% Fibonacci retracement level at $0.061, a 17.33% correction to the 78.6% Fibonacci retracement level at $0.050 can be expected,
Author

Akash Girimath
FXStreet
Akash Girimath is a Mechanical Engineer interested in the chaos of the financial markets. Trying to make sense of this convoluted yet fascinating space, he switched his engineering job to become a crypto reporter and analyst.


