VeChain Price Forecast: VET’s bullish consolidation suggests completion of a 75% bull rally
- VeChain price is on track to hit its 75% target at $0.083.
- Supporting this upswing is the bull flag pattern formed on the 4-hour chart.
- A decisive close above $0.064 will trigger a 45% upswing.

VeChain price hints at a continuation of its uptrend as it consolidates in a bullish pattern on a 4-hour chart.
VeChain price vies new all-time highs
Vechain price has been forming a series of higher highs and higher lows since December 26, 2020. By drawing trendlines along these pivot points, an ascending parallel channel seems to evolve.
On February 28, VET formed a bottom as it tapped the channel’s lower trendline at $0.036. Since then, VET has seen a considerable surge in bullish momentum that has catapulted it by 87% to a new all-time high at $0.068.
Therefore, this technical formation suggests that VeChain price could ascend 75% towards the upper trendline around $0.083.
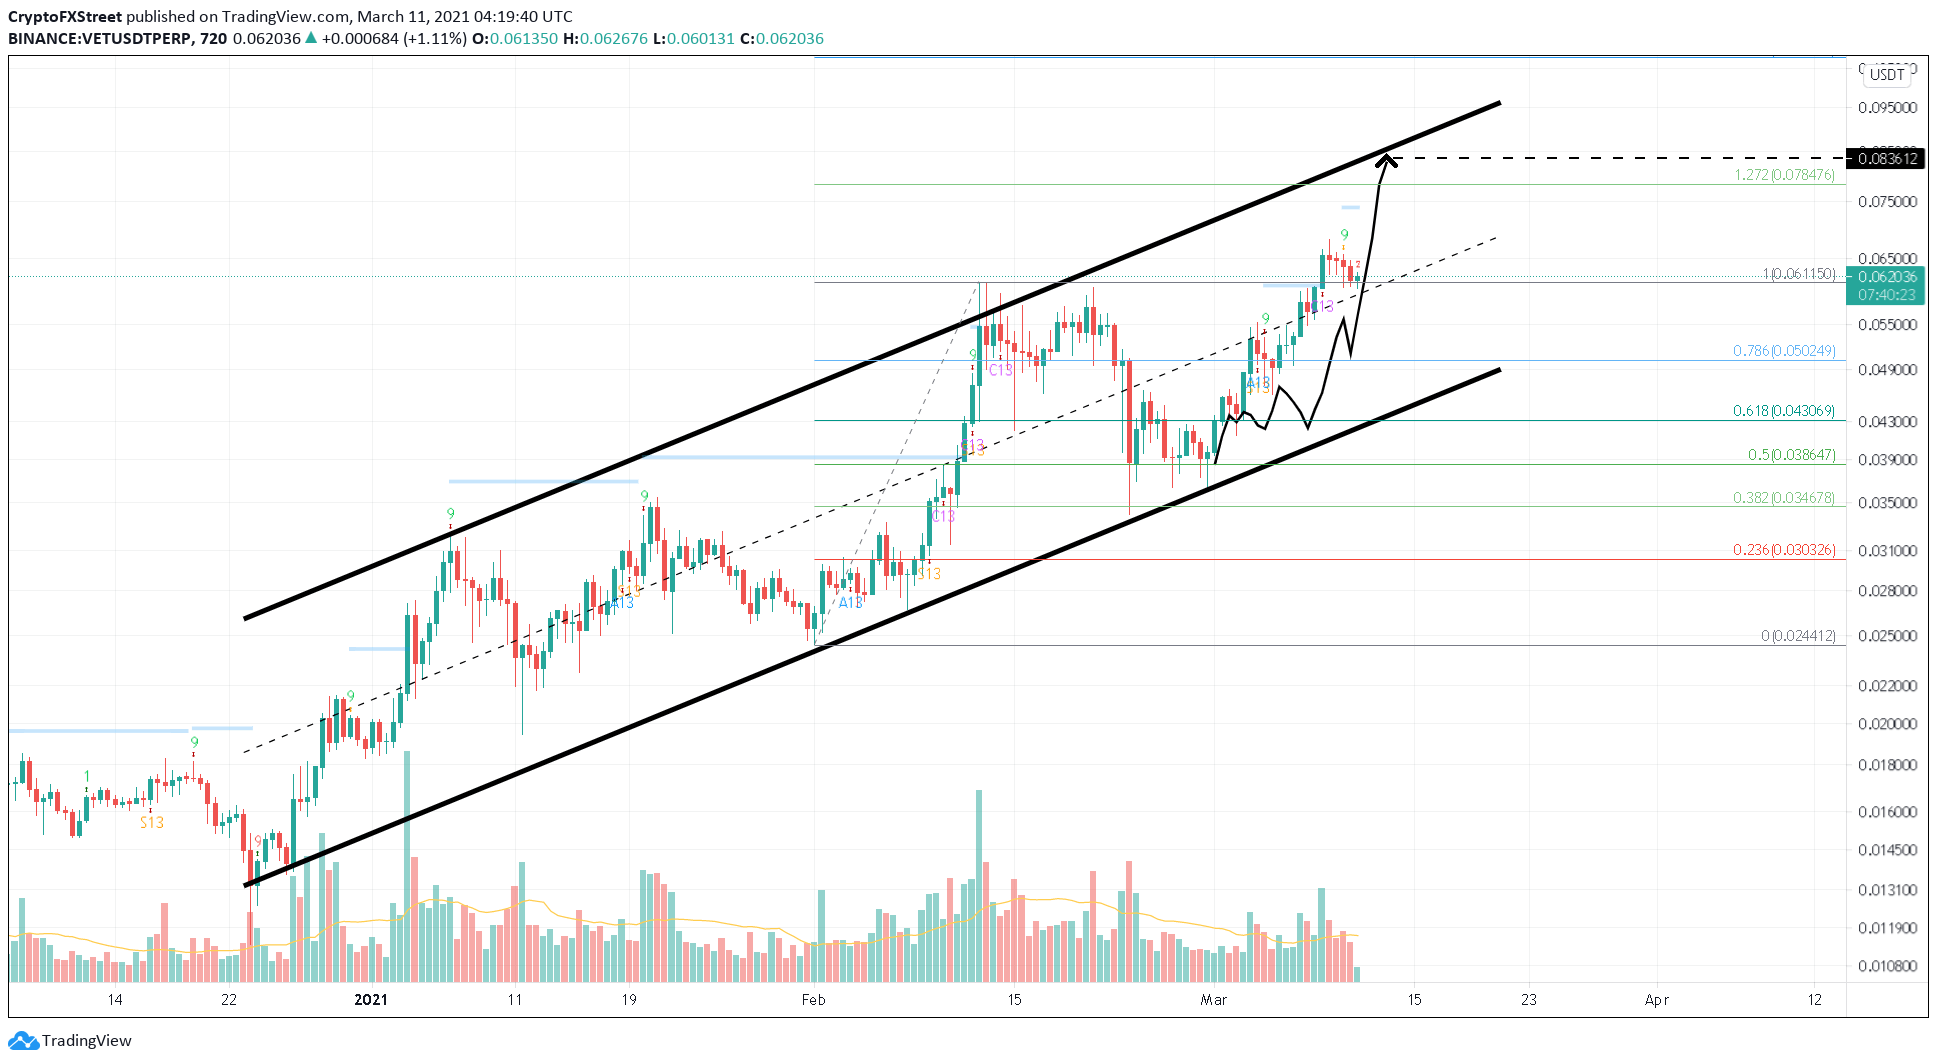
VET/USDT 12-hour chart
Adding credence to the bullish outlook is VET’s bullish pattern on the 4-hour chart. VeChain price has been forming lower highs and lower lows after a 45% upswing to a new all-time high. VET seems to be in a “bull flag” formation, especially if the initial spike in price is considered as a “flag pole” and the consolidation that followed it as a “flag.”
This setup projects a 45% upswing, which is the flag pole’s length added to the breakout point at $0.064. The target puts VET price at $0.092. A decisive 4-four candlestick close above the flag will confirm VeChain’s bullish breakout and suggest the start of a bull rally.
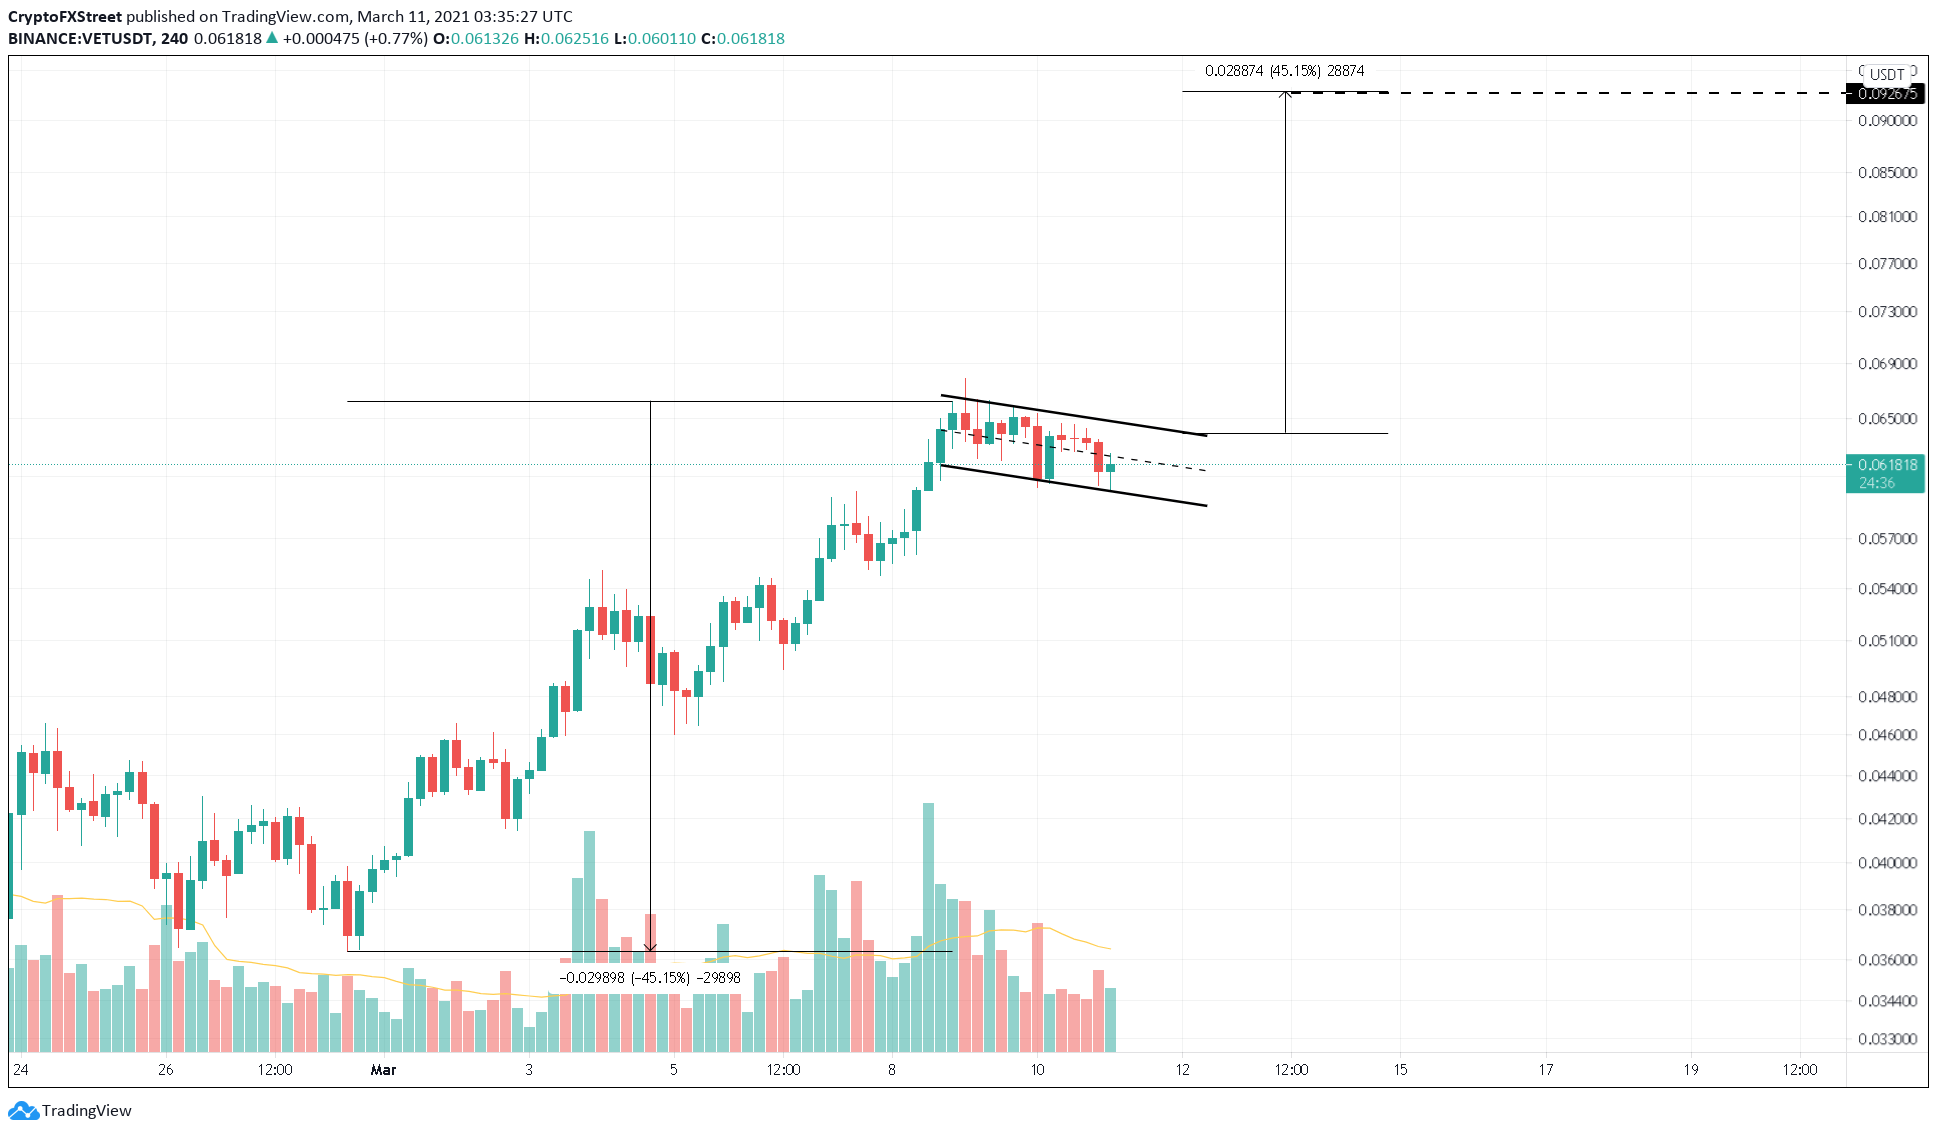
VET/USDT 4-hour chart
Regardless of the bullish outlook, the Tom DeMark (TD) Sequential indicator has flashed a sell sign in the form of a green nin candlestick on the 12-hour chart. Hence, a continuation of selling pressure here could lead to a downward breakout of the flag, which would invalidate the bullish outlook. In such a situation, VeChain price could be expected to drop 8% to $0.054.
Author

Akash Girimath
FXStreet
Akash Girimath is a Mechanical Engineer interested in the chaos of the financial markets. Trying to make sense of this convoluted yet fascinating space, he switched his engineering job to become a crypto reporter and analyst.



