Uniswap Price Prediction: UNI on-chain metrics spell trouble following a 300% bull rally
- Uniswap price may be due for a correction as multiple technical indicators flash sell-signals.
- Several fundamentals also predict that a local top might be in for the DeFi token.
- A breakdown of the critical demand area at $17 could signal the start of a pullback.

The parabolic surge in Uniswap price could be coming to an end as a confluence of technical and fundamental indicators suggest a pullback on the cards. An increasing price coupled with decreasing volume and rising retail chatter hint that Fear Of Missing Out [FOMO] is at its peak, which usually leads to a price drop.
Uniswap price faces immense bearish pressure after a 300% rally in 20 days
The UNI token saw a 300% surge in its price in less than 20 days starting from January 12, and this surge can be attributed to a multitude of on-chain metrics. At the time of writing, the DeFi token is failing to trade above an immediate demand barrier at $17.97 and could be due to retracement after the sell-signal flashed by the TD Indicator on the 1-day chart.
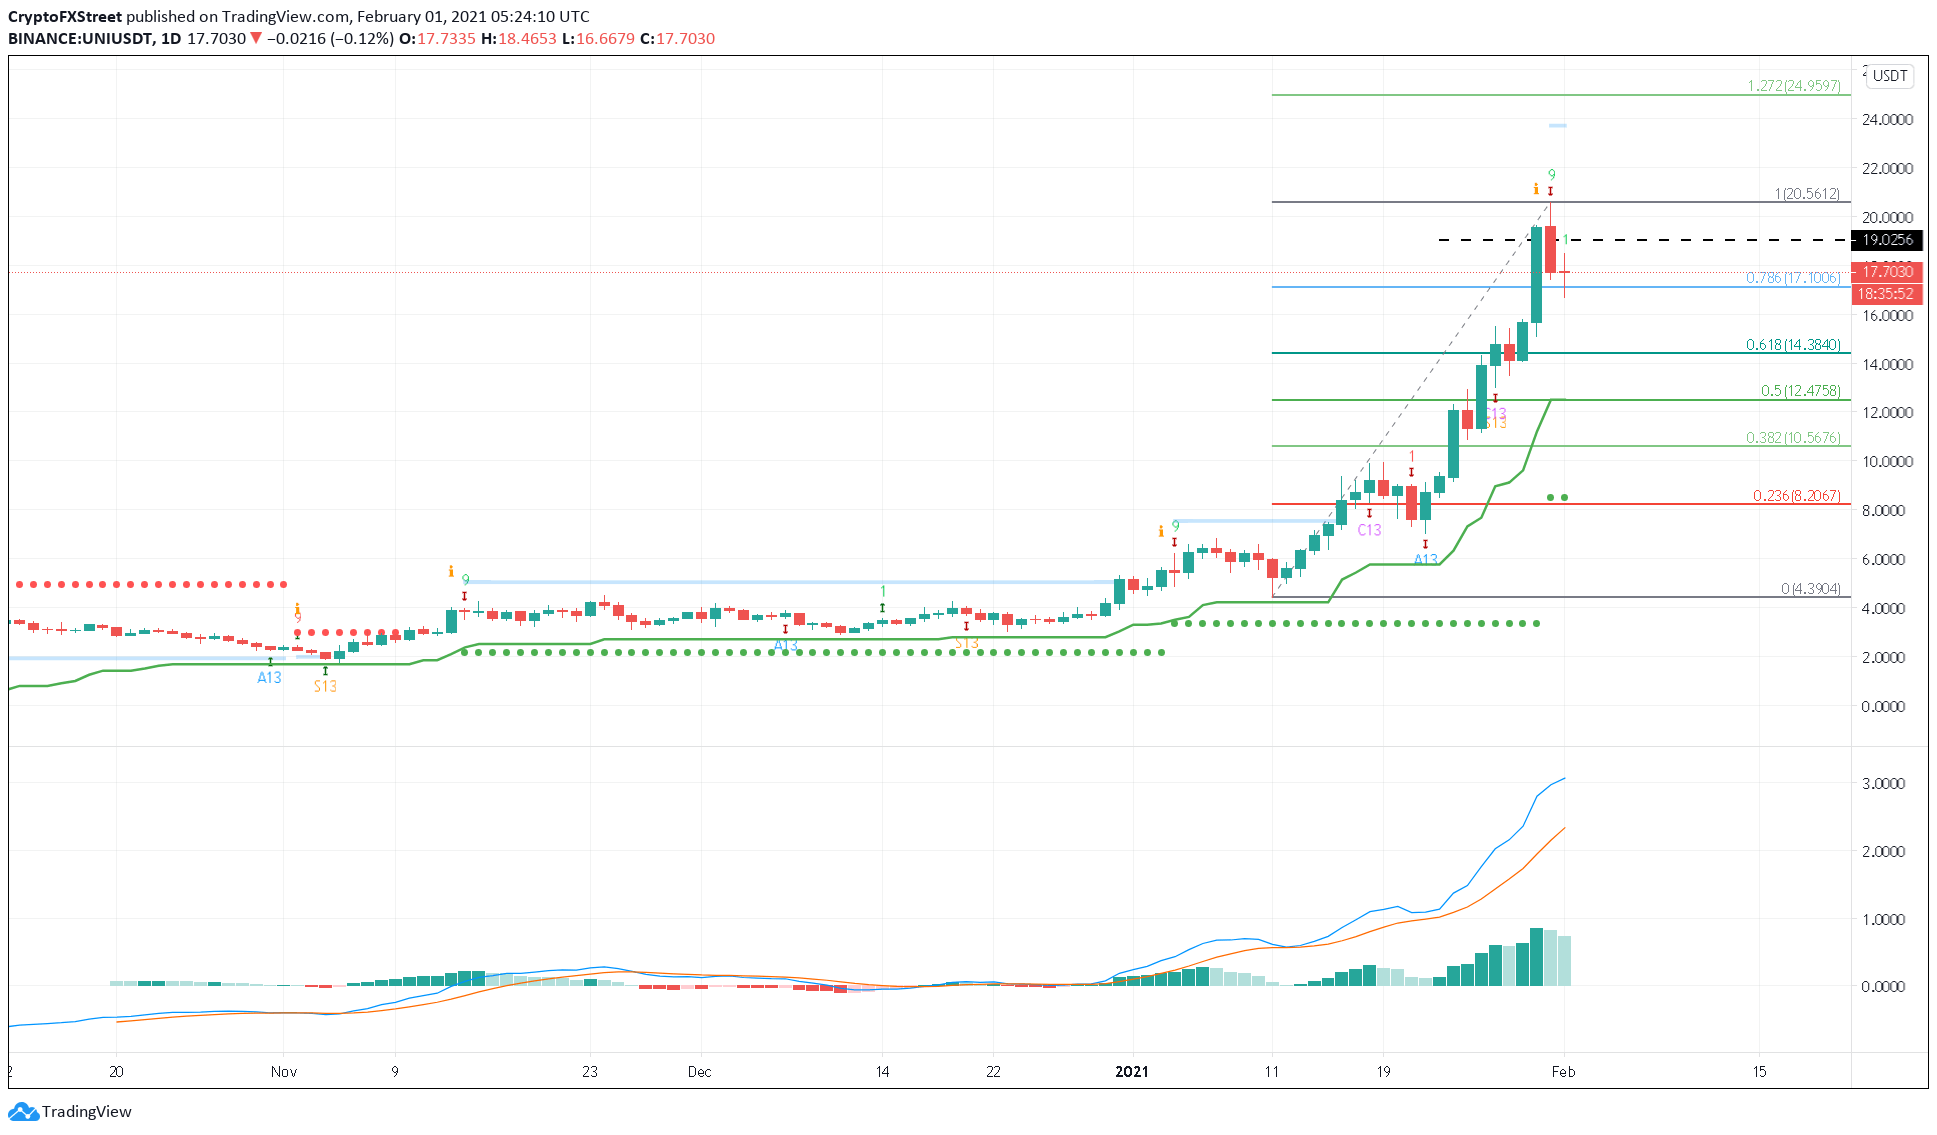
UNIUSDT 1-day chart
In addition to the TD Sequential indicator, the Moving Average Convergence Divergence [MACD] Indicator presented a decreasing buying momentum due to diminishing histograms.
The Fibonacci Retracement tool extending from the trough to peak between January 11 and 31 suggests that another crucial demand barrier exists at 78.6% Fibonacci level or $17.106. A breakdown of this level could signify the start of the correction phase for the UNI token.
On-chain metrics suggest discrepancies
Uniswap price surge was exponential, no doubt. However, the volume doesn’t concur, resulting in a divergence, which indicates weakness in the rally.
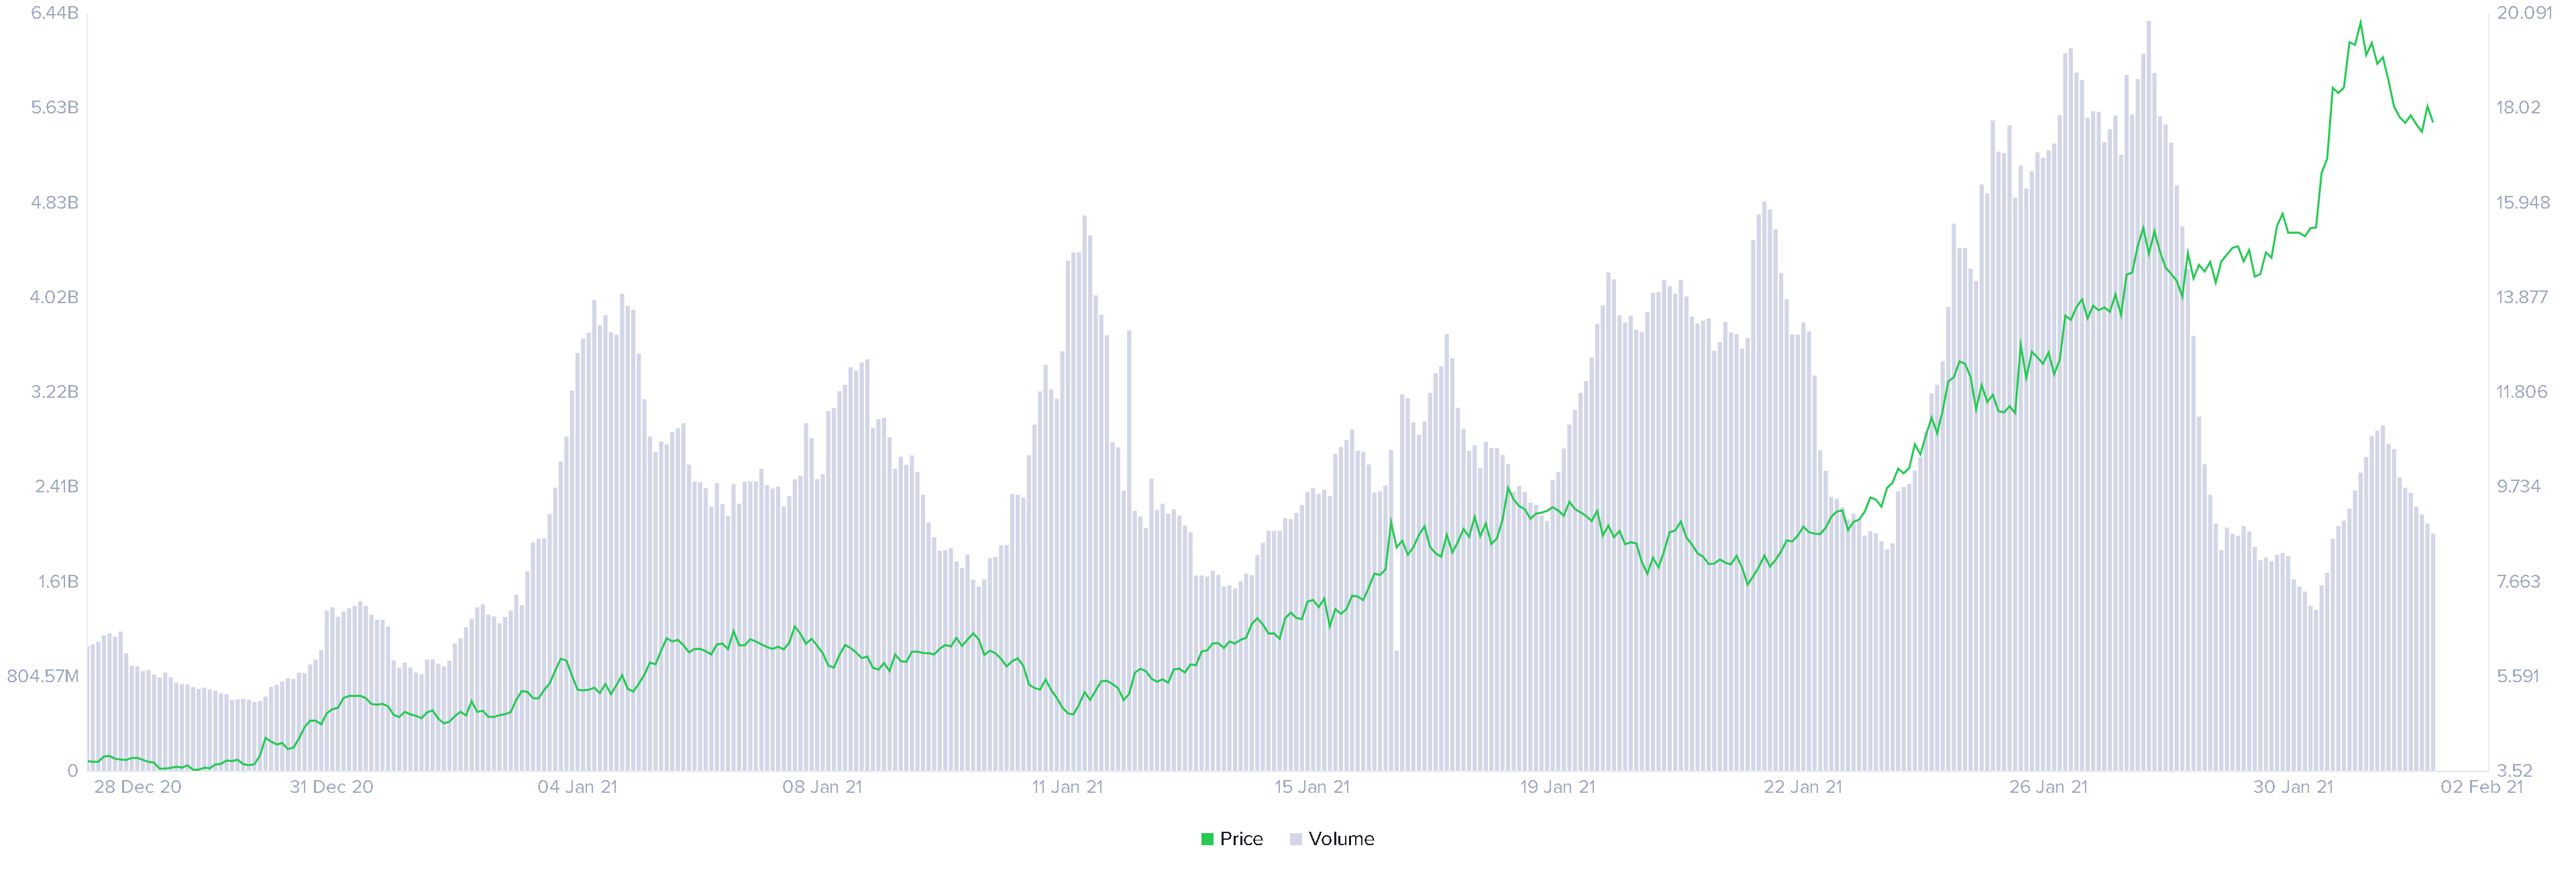
Price vs. volume chart
The volume surge for UNI token peaked on January 28, but the price continued to surge until January 31, suggesting that the $20 could be the local top.
An exponential surge typically invites the retail investors, and more often than not, FOMO happens at the peak.
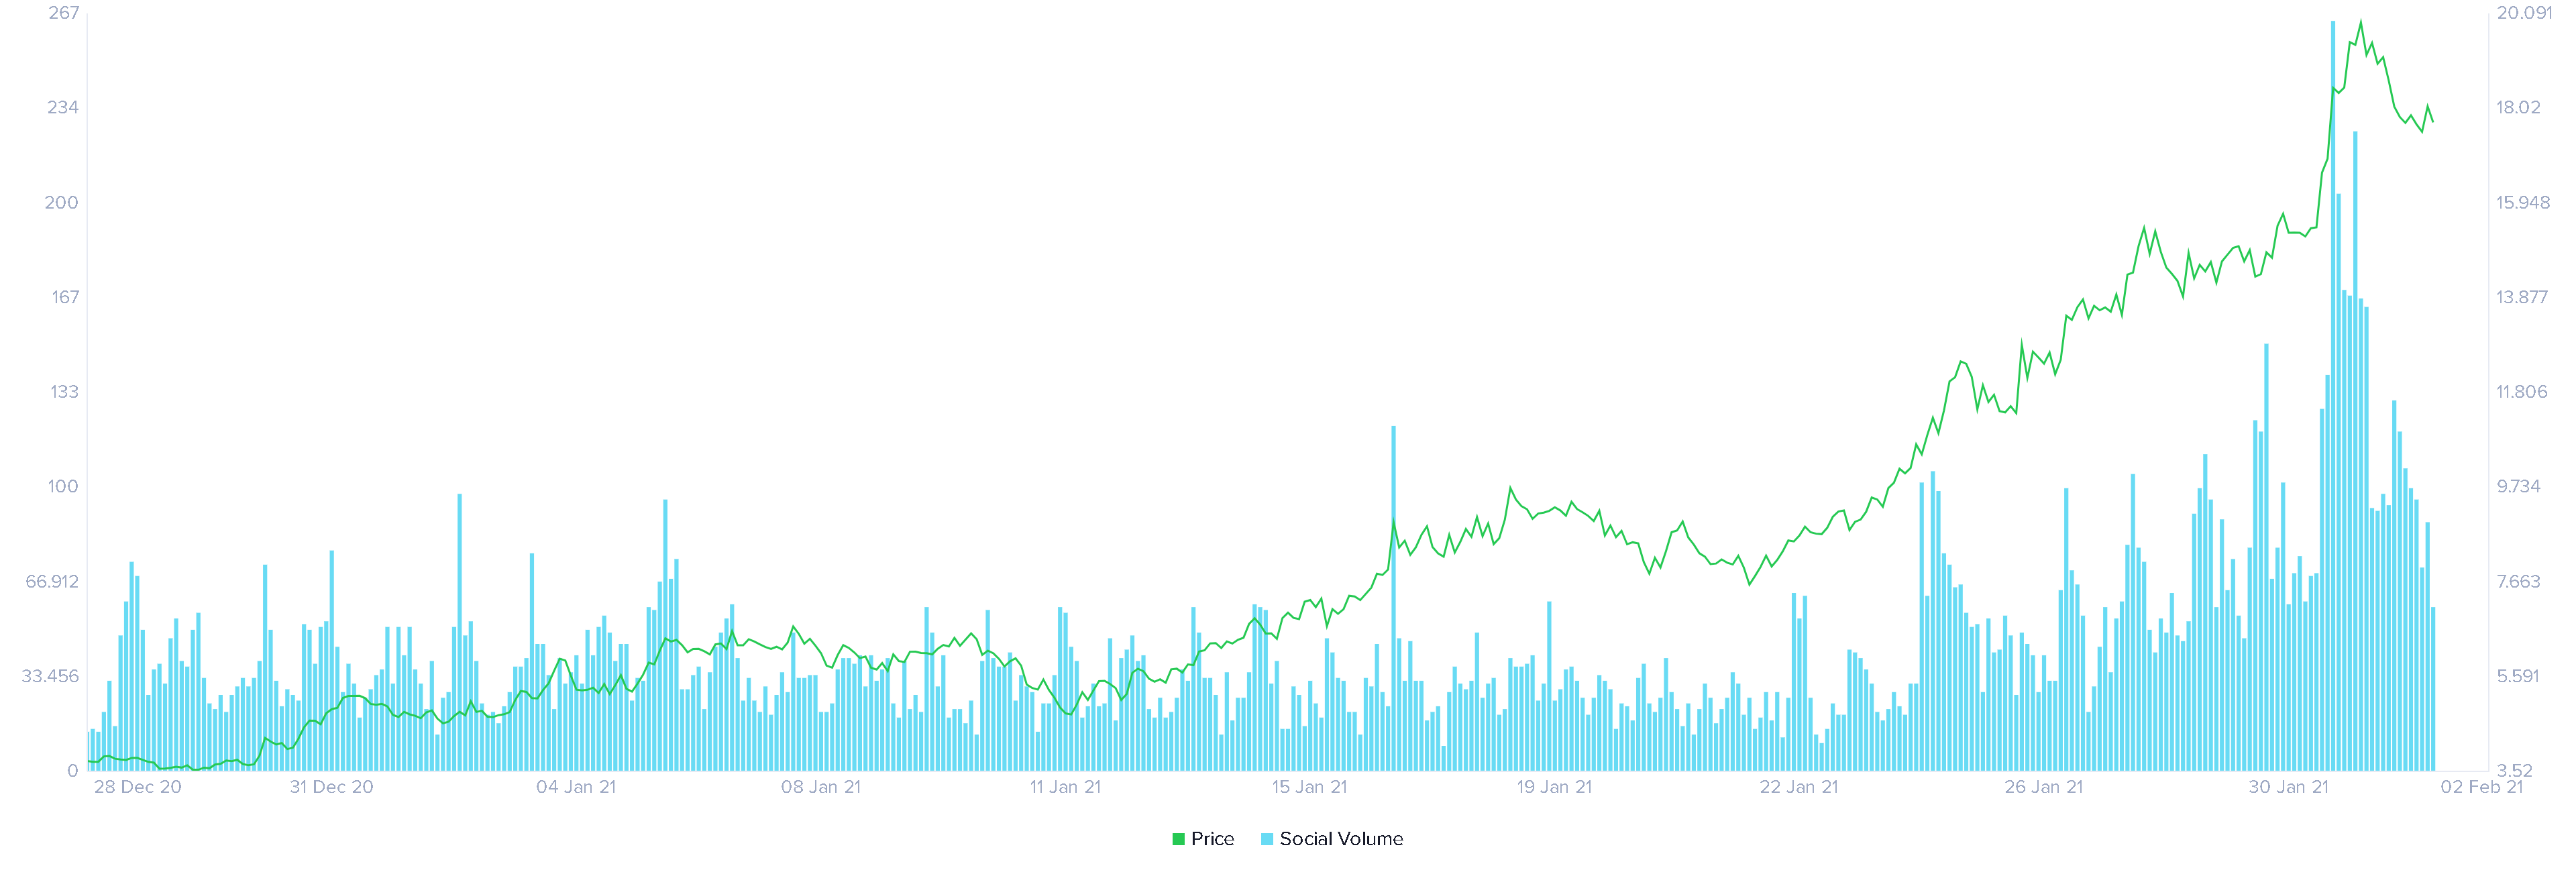
Uniswap Social volume
Uniswap token’s social volume hit a high on January 30 as the price closed above $18, indicating peak investor FOMO and a potential local top.
Additionally, whales that hold 1,000 UNI to 1,000,000 UNI have been taking profit or redistributing their holdings since January 24. This process picked up on January 31, adding credence to the local top hypothesis.
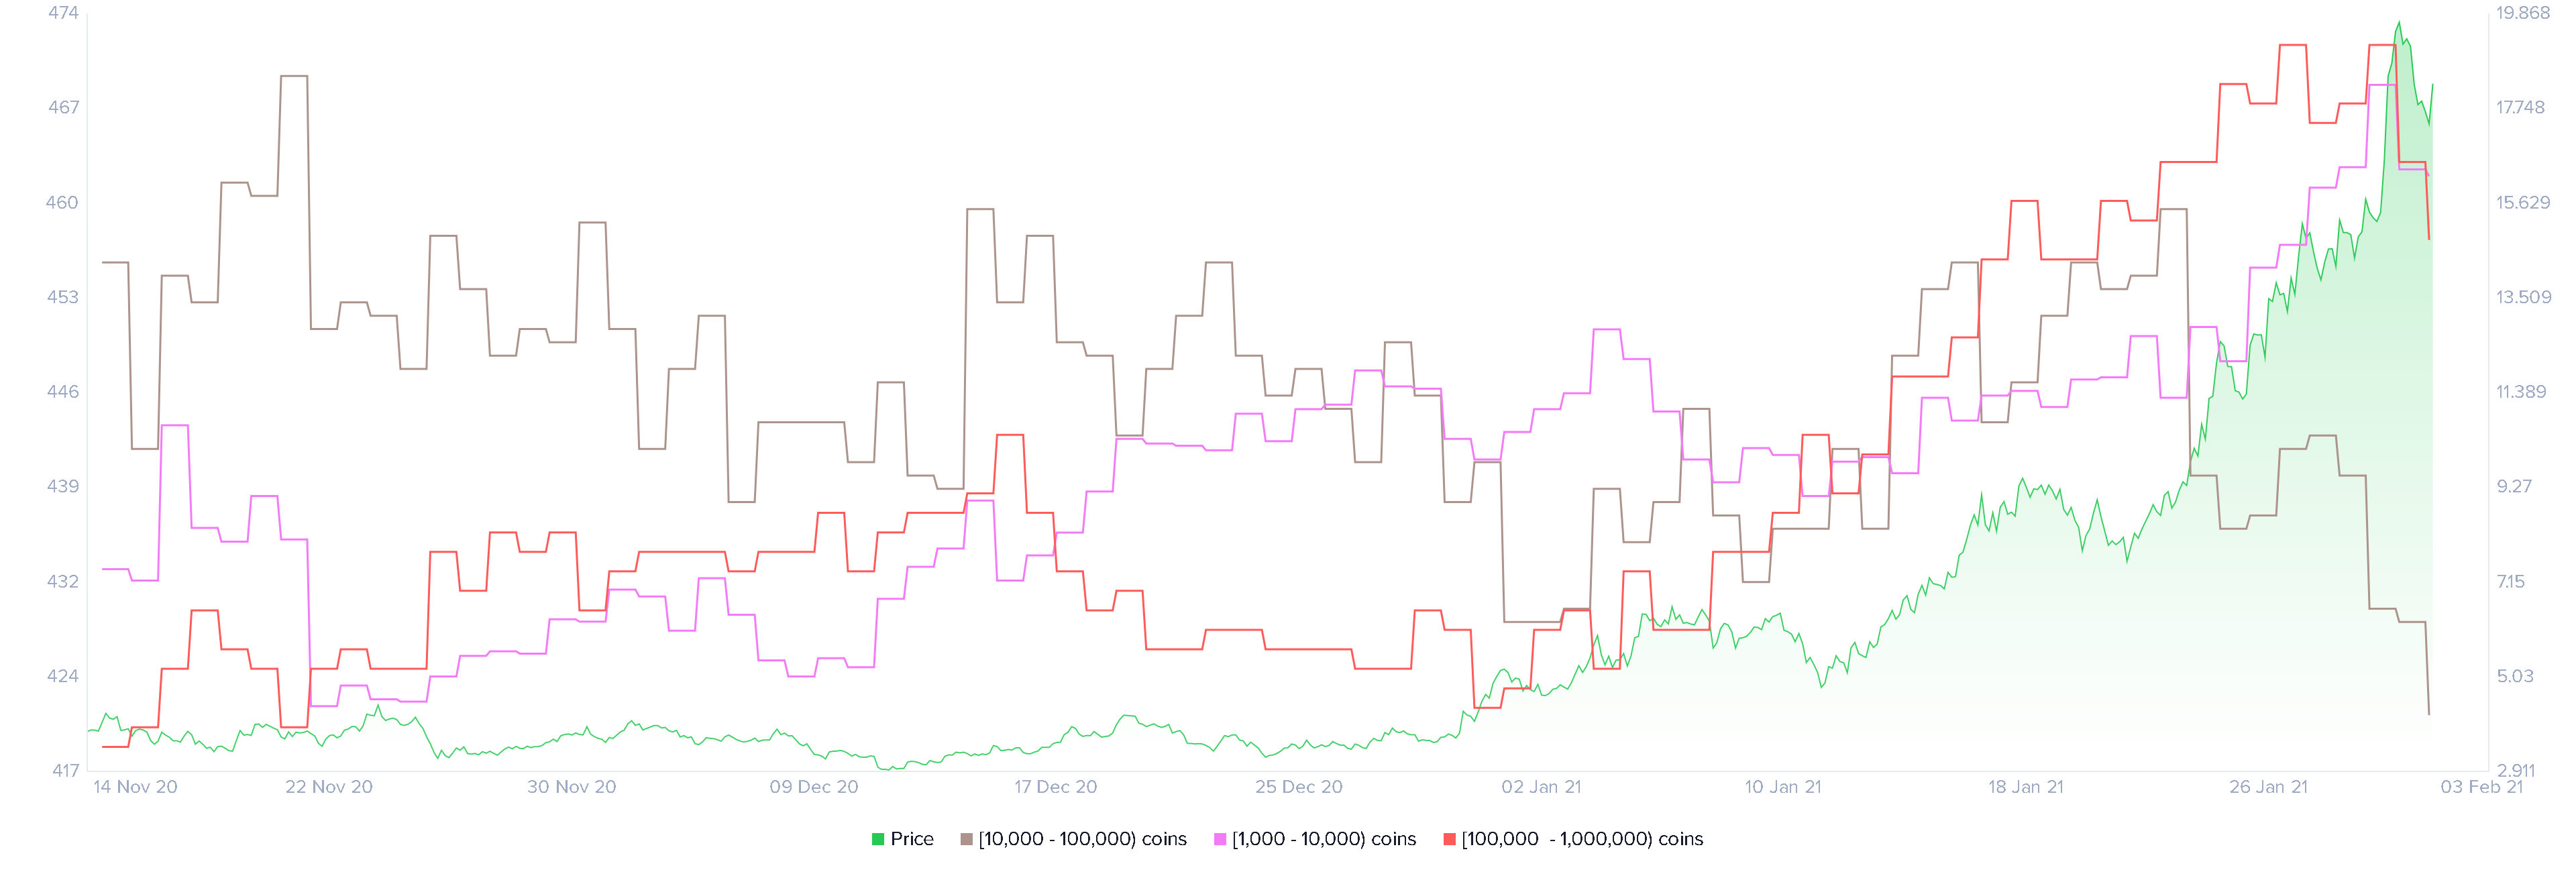
Whale holder distribution
Perhaps, the most significant on-chain metric that matters is the increase in UNI supply held on exchanges. This increase in exchange supply/deposits is a tell-tale sign that users are ready to take profits.
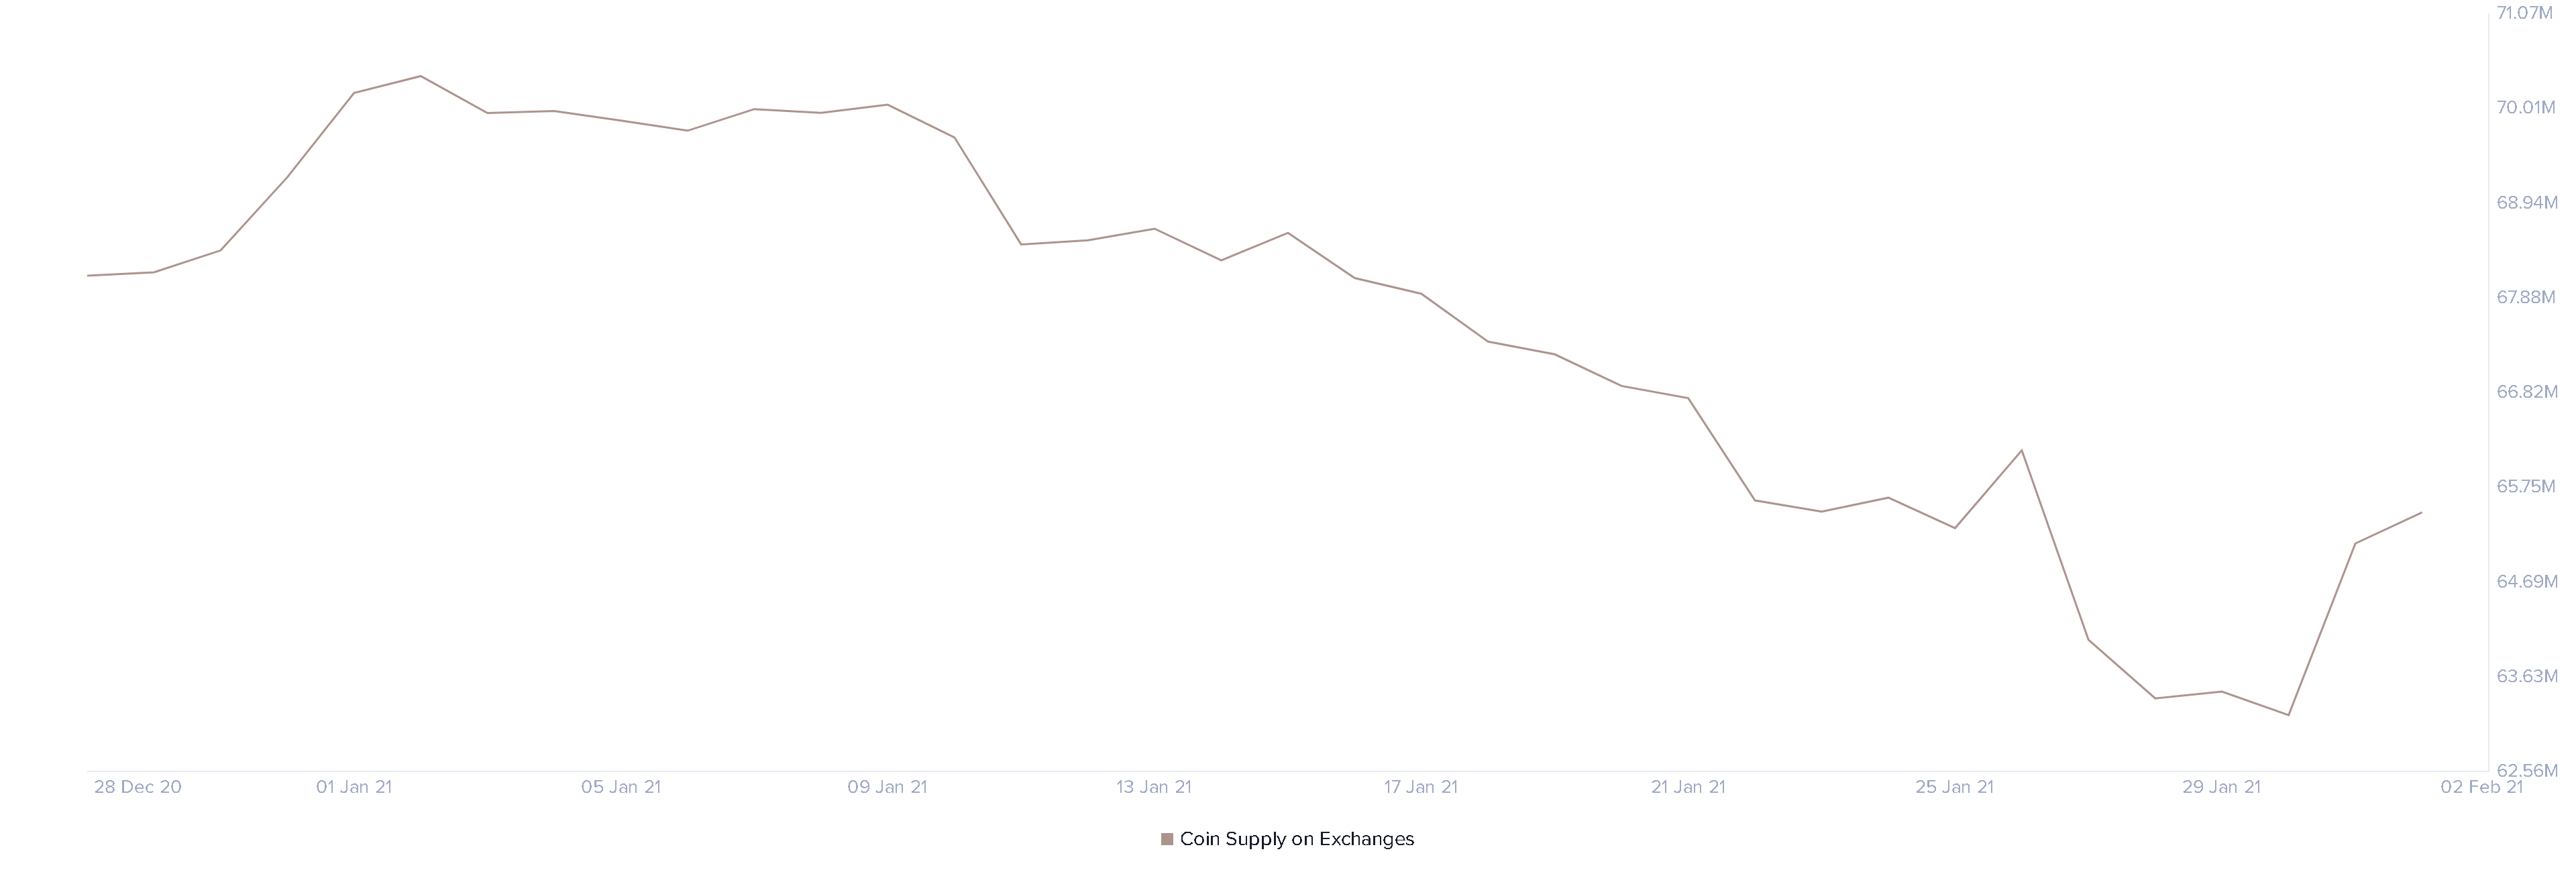
Coin supply on exchanges
UNI tokens on exchanges increased by 3.6% at the time of writing since January 31, indicating that a correction might be inevitable for the DeFi token.
A breakdown of the critical support at $17.106 could spell disaster for the coin as the next area of support is approximately 16% lower, at $14.38. That level coincides with the 61.8% Fibonacci level, where 14.51 million UNI were previously purchased by 10,000 addresses, as suggested by IntoTheBlock’s In and Out of the Money Around Price [IOMAP].
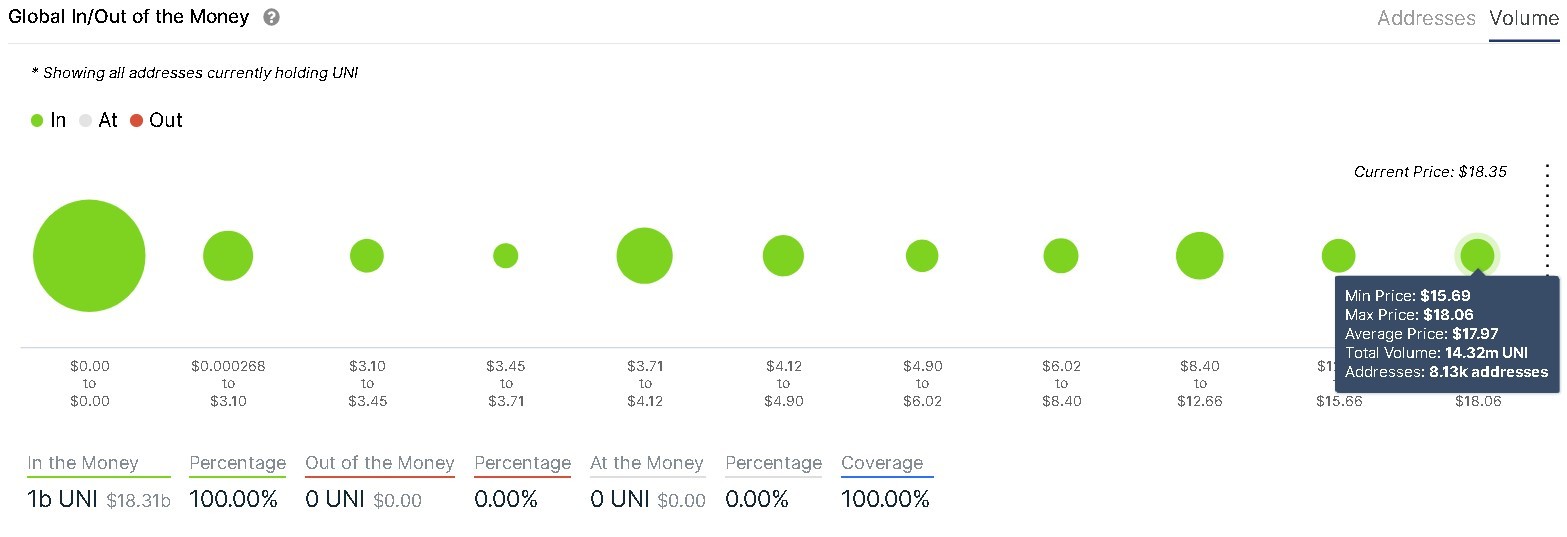
IOMAP chart
Although unlikely, it is worth noting that a close above $19 could alleviate the short-term bearish pressure and perhaps even invalidate it, provided there is volume backing this surge followed by a retest of the all-time high [ATH] at $20.56.
Author

FXStreet Team
FXStreet
Composed of a group of economic journalists and FX experts, the FXStreet content team produces and oversees all content published on FXStreet. It provides a purely journalistic approach to the Forex market.



